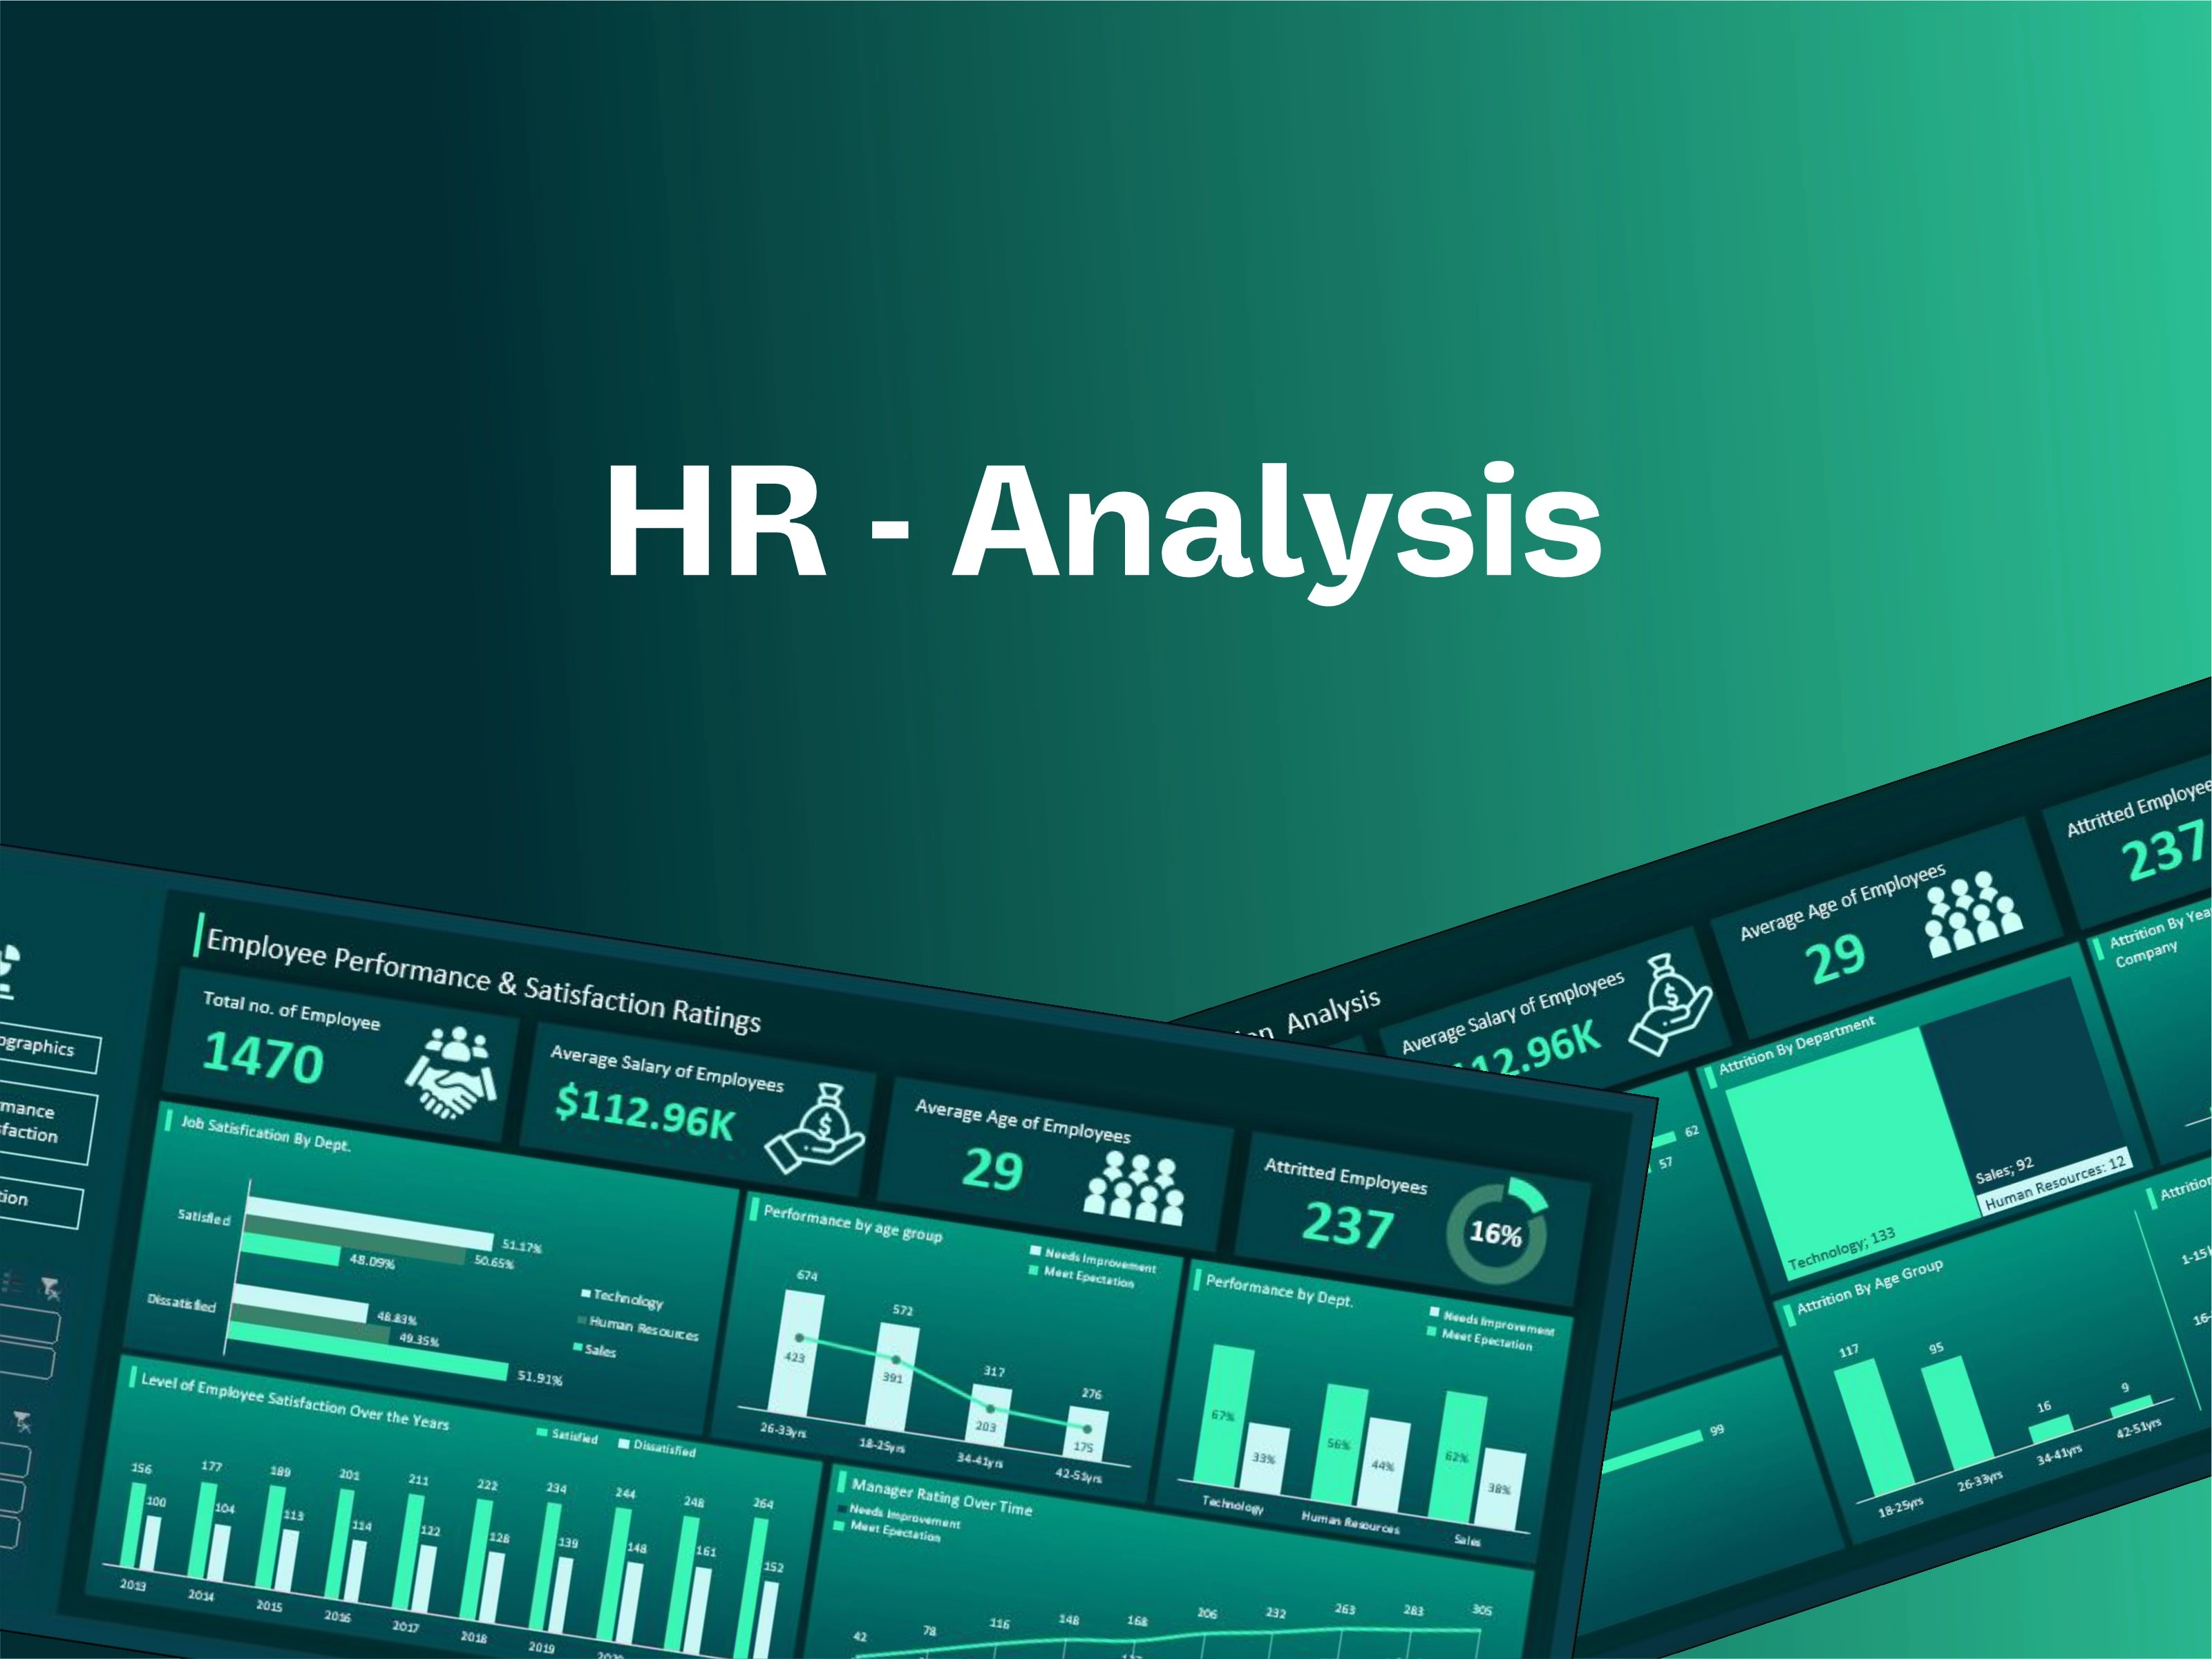
HR - Analysis
Yusuf Olanrewaju
PROJECT OVERVIEW
This project involved uncovering key insights from a company dataset by studying Employee Demographics , Employee Performance & Satisfaction Ratings, & Employee Attrition.
This project is driven by the need to understand;
Who Is Leaving?
Why They Are Leaving?
How Performance And Satisfaction Vary Across The Organization?
so that the company can implement effective strategies for talent retention and development.
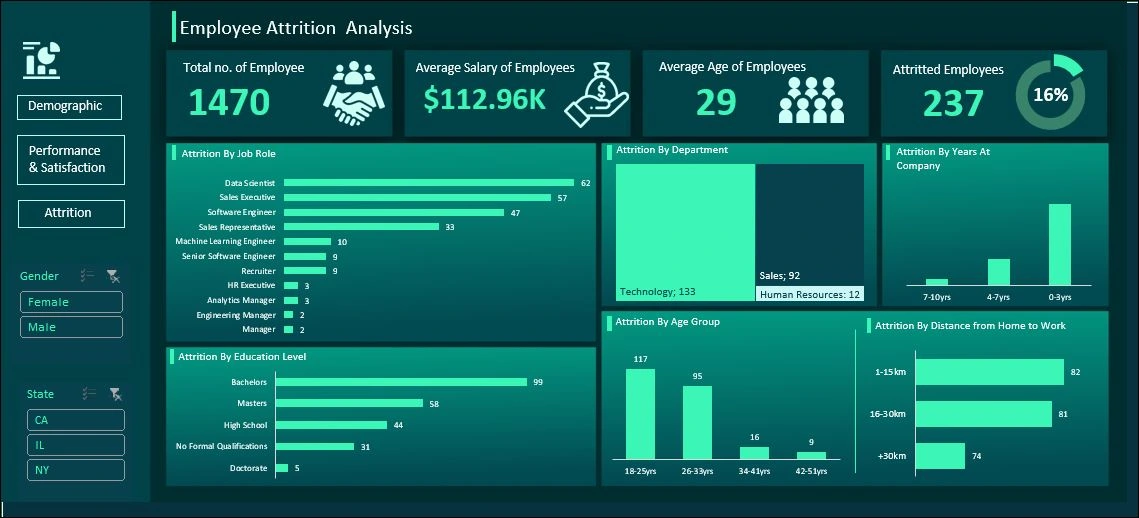
Dashboard 1: Employee Demographics
Provides an overview of employees
KEY METRICS
Total Employees: 1,470
Attritted Employees: 237
Attrition Rate: 16%
Average Salary of Employees: $112.96K
Average Age of Employees: 29 years
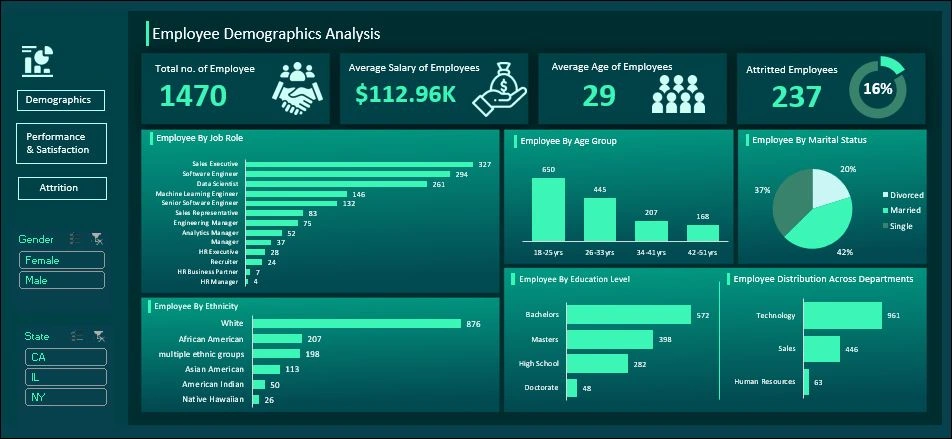
Dashboard 1: Employee Demographics
Dashboard 2 & 3 Answers the Questions:
Who Is Leaving?
By job role : the profiles of employees with the highest attrition are Data Scientist (62), Sales Executives (57), Software Engineers (47)
By Age group: 18-25 years (117 attritions), 26-33 years (95 attritions). Combined, 89% of attrition comes from employees under 34years
By Education Level: Bachelors Degree holders (99), Master’s Degree holders(58), High school grads (44).
By Department : Technology (133 attritions), Sales(92 attritions) These two departments alone account for 95% of attrition.
By Tenure : New employees(0-3 years at company ) the highest attrition group.
By distance from home : Attrition is relatively even across each distance
Dashboard 2
Dashboard 3
Why They Are Leaving?
Most attrition is among younger employees (under 34) with less than 3 years at the company, this may be due to issues with onboarding experience , or career growth
Young employees of age brackets 18-33 years have the highest performance ratings, but despite the good performance , they are still the same age bracket with the highest attrition . the cause of them leaving the organization is pointing to non-performance related issues probably career development gaps.
The early years show lower manager effectiveness scores. Poor management or leadership support may have impacted the employee experience , which must have led to the attrition of employees.
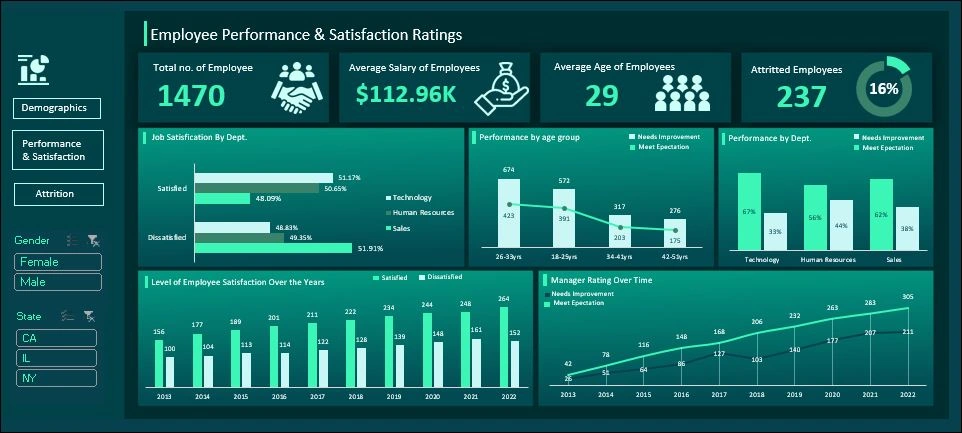
How Performance And Satisfaction Vary Across The Organization?
By Age Group : younger employees of age bracket (18-33) consistently outperform older peers 67%+ meet expectations while Older age groups (34+) showed lower performance.
Satisfaction levels have grown slowly year over year. however, a significant number of employees remain dissatisfied which is more observable in recent years (2021-2022)
Manager ratings have steadily improved over time, this indicates progress across the organization. Although quite a significant number also need to improve and this is easily observed in recent years(2020, 2021, &2022)
Dashboard 3
CONCLUSION
In Conclusion, this analysis show how most attrition are occurring and the various factors leading to high attritions. To address issues faced by the organization the company can focus on improving onboarding, career development, and management support particularly in high attrition roles. Strengthening these areas can boost retention, enhance employee satisfaction, and protect valuable talents.
Like this project
Posted Sep 16, 2025
This project involves uncovering key insights by studying Employee Demographics , Employee Performance & Satisfaction Ratings, & Employee Attrition.
Likes
1
Views
4
Timeline
Aug 12, 2025 - Sep 15, 2025