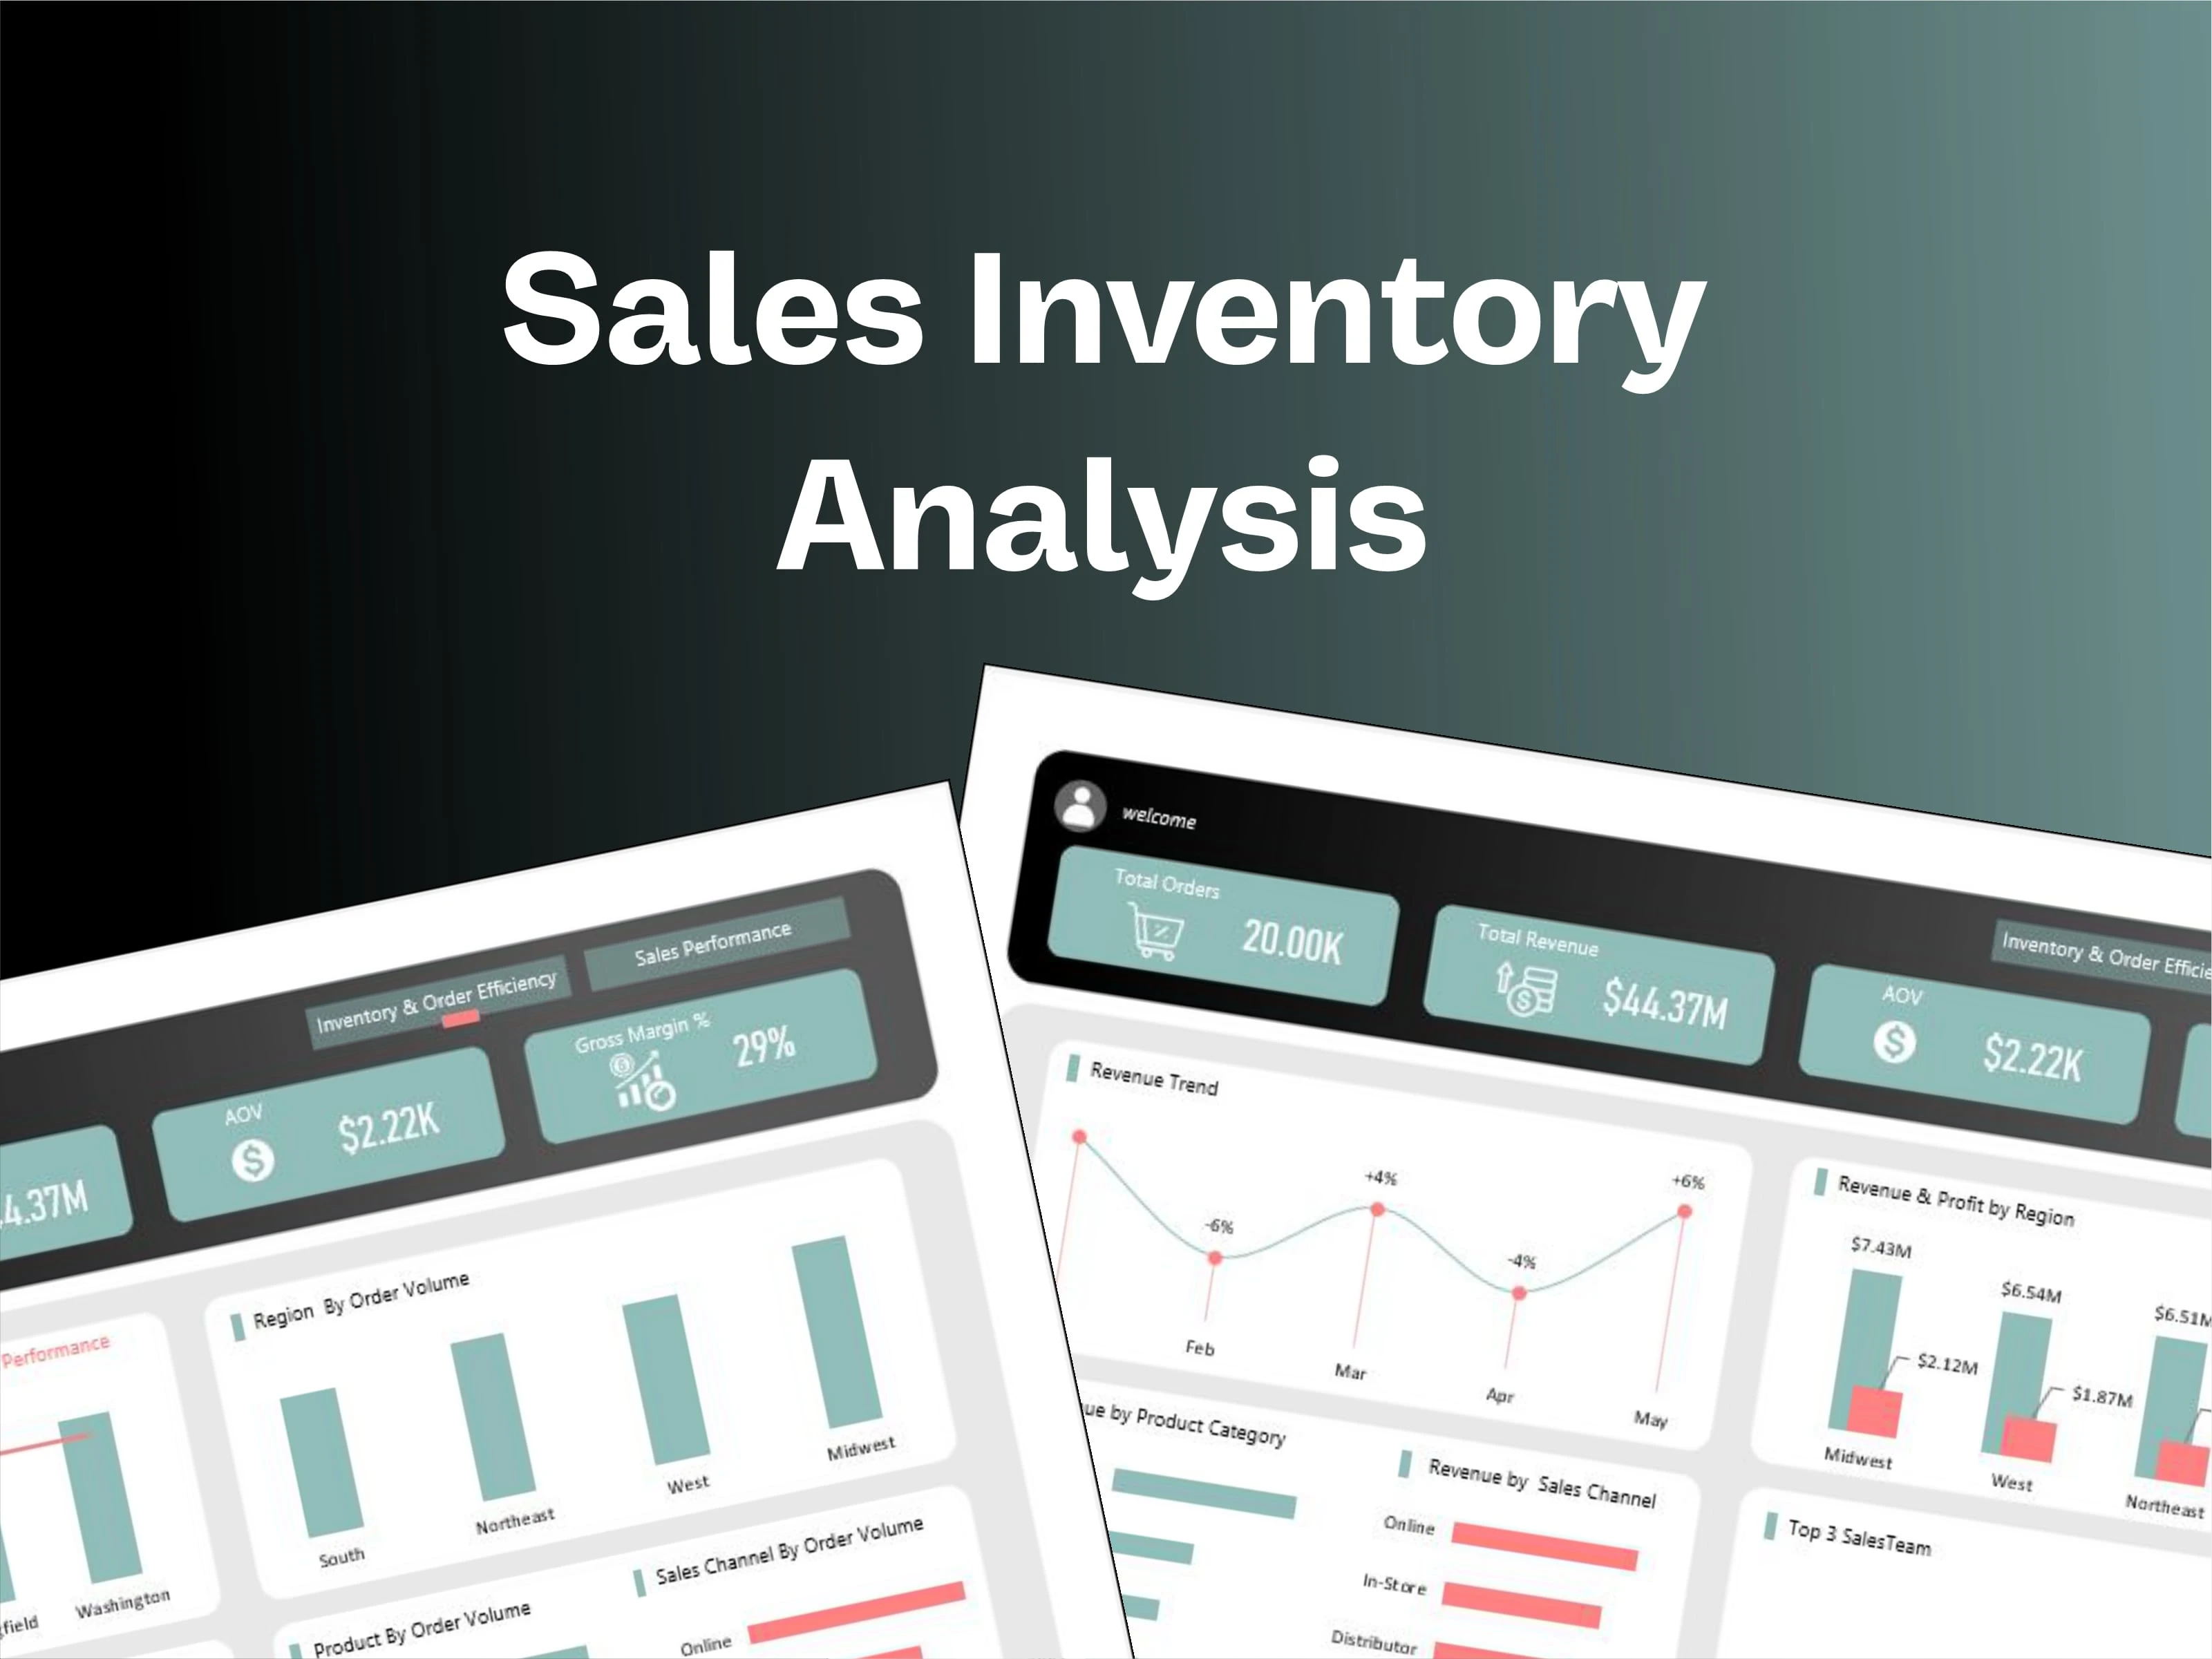
Sales Inventory Analysis
Yusuf Olanrewaju
Introduction:
In this project, I set out to uncover the dynamics shaping sales and inventory efficiency. I explored regional trends, product-level demand, sales channels, and team contributions to understand what drives revenue and where operational bottlenecks may exist.
The goal is clear: identify the patterns that fuel growth and translate them into actionable insights that improve sales performance, optimize order efficiency, and strengthen overall business outcomes.
Data Cleaning
Before diving into the analysis, we cleaned the data by:
Checking and handling missing values.
Verifying data types for each column.
Removing duplicate records
Analytical Approach
To uncover meaningful insights, I applied a structured analytical process designed to connect operational efficiency with sales performance. The approach focused on breaking down the data into key dimensions and examining patterns across regions, products, channels, and teams.
Measuring overall sales and efficiency: I began by calculating the total revenue, total cost, and gross margin. This provided a baseline view of financial performance and showed whether growth was being achieved profitably. Alongside this, I reviewed order volumes to capture how demand translated into transactions. This set the foundation for exploring both growth drivers and operational bottlenecks.
Comparing regions and sales channels: Next, I segmented revenue and order data across regions and sales channels. Using PivotTables, I compared how much each region contributed and whether some channels consistently outperformed others. Some patterns were expected, like stronger results in high-demand regions, while others revealed surprising underperformance in certain channels. This highlighted where resources were being maximized and where opportunities were being missed.
Identifying product-level trends: I then drilled down into product categories and items. I was able to see which products generated the highest revenue
Tracking performance over time: Sales are never static. I analyzed monthly revenue and order trends to identify growth periods, seasonal fluctuations, and potential slowdowns. These trends provided context for whether performance improvements were sustained or short-lived.
Assessing team contribution: Sales teams are key drivers of results. I compared performance across different teams to spot top performers. Recognizing these patterns is essential for designing fair incentives and identifying where additional support may be needed.
Linking efficiency with profitability: Finally, I evaluated how order efficiency connected with gross margin. Strong sales don’t always equal strong profits — inefficiencies in processing, fulfillment, or cost structures can erode gains. By linking operational performance with financial outcomes, I could pinpoint where efficiency improvements would directly boost margins and strengthen long-term growth.
Results
Dashboard Overview To bring this analysis to life, I created two dashboards that showcase the most critical insights from the project. These dashboards make it easy to explore where orders are coming from, which products and regions are performing best, and how sales trends are shifting over time.
The Inventory & Order Efficiency dashboard reveals how order volumes, regional distribution, and seasonal trends impact stock management. It helps identify top-performing products and channels while highlighting areas that need attention for better fulfillment planning.
The Sales Performance dashboard focuses on revenue growth, profitability by region, and channel contribution. It also provides visibility into top-performing sales teams and product categories, making it easier to connect performance trends with actionable strategies
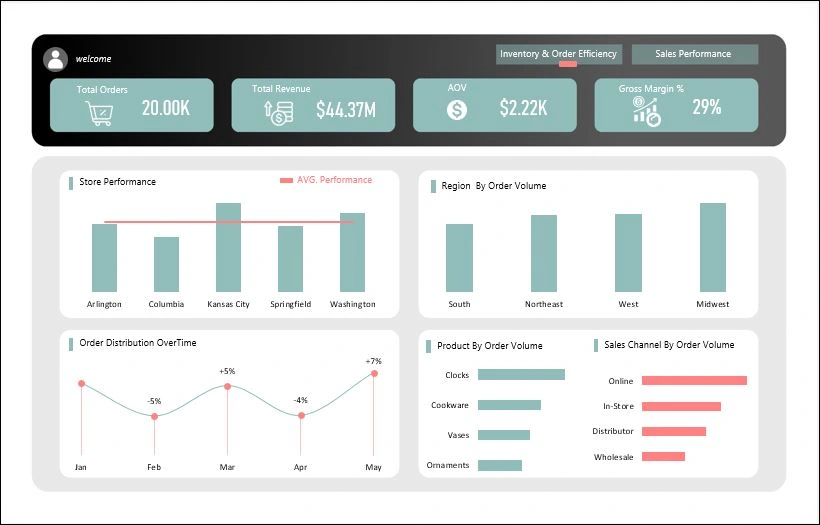
Dashboard 1
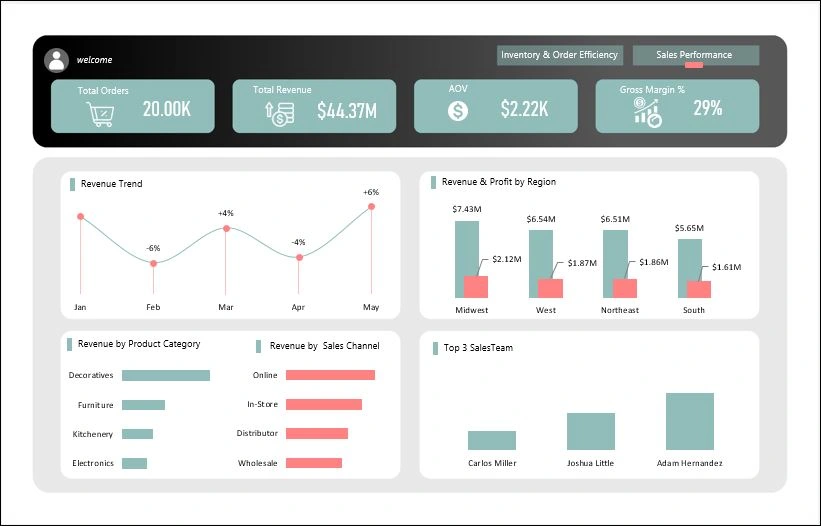
Dashboard 2
Key Insights
Overall Performance Metrics
Total Orders: 20,000
Total Revenue: $44.37M
Average Order Value (AOV): $2,220 per order
Gross Margin: 29%
Inventory & Order Efficiency – Key Insights
Kansas City Leads, Columbia Struggles: Among all stores, Kansas City outperformed every other location, well above the average line. On the other hand, Columbia is lagging significantly behind average performance, signaling potential issues such as low demand, limited product assortment, or poor customer engagement. These gaps deserve attention
Midwest leads in order volume; South lags: Regionally, Midwest shows the highest order volume, while the South records the lowest. The Northeast and West fall in-between. That means inventory and fulfillment capacity should be weighted toward the Midwest to avoid stockouts
Orders Rebounded in May After Seasonal Dips: The year started slow with a 5% dip in February after January’s decline. Things turned around in March (+5%), dipped slightly again in April (-4%), and then surged by +7% in May. This pattern hints at seasonal demand cycles
Clocks Are the Star Products: When looking at order volumes, Clocks top the list, followed by Cookware, while Ornaments rank the lowest. This suggests that decorative and functional items sell best
Online Channels Are Dominating Sales: The online channel leads all others, far ahead of in-store, distributor, and wholesale. This confirms that digital channels are driving growth
Sales Performance – Key Insights
Revenue Is Climbing Again: The revenue trend mirrors order growth. After a 6% drop in February, sales bounced back in March (+4%), dipped slightly in April (-4%), and then jumped 6% in May. This fluctuation reinforces the need for stronger strategies during slow months to maintain steady growth.
Midwest Is the Revenue and Profit Powerhouse: The Midwest leads with $7.43M in revenue and $2.12M in profit, making it the most profitable region. The West and Northeast follow closely, while the South lags with $5.65M revenue and the lowest profit ($1.61M).
Decoratives Drive the Highest Revenue: Decorative products generate the most revenue, followed by Furniture and Kitchenware, while Electronics contribute the least. This suggests that aesthetic and lifestyle products are the backbone of sales
Online Is the Revenue Leader Too: Just like in order volume, online channels dominate revenue, with in-store coming second. Distributor and wholesale sales remain minimal. This reinforces the trend toward digital-first commerce.
Adam Hernandez Leads the Sales Team: Among the top three performers, Adam Hernandez stands out as the leader, followed by Joshua Little and Carlos Miller
Recommendations
Inventory & Order Efficiency
Optimize Inventory Allocation by Region : Increase stock allocation in the Midwest, where order volumes are highest, to prevent stockouts. Reassess inventory for the South region, which has the lowest orders, to reduce overstock and carrying costs.
Address Underperforming Stores: Conduct a performance audit for Columbia, focusing on: Product assortment Local marketing strategies Replicate Kansas City’s success strategies in other stores where feasible
Align Stock Levels with Seasonal Demand: Implement demand forecasting models to better anticipate dips and peaks, avoiding both stockouts and excess inventory.
Strengthen Best-Selling Categories Increase procurement and marketing for Clocks and Cookware, which lead in orders. For low-performing categories (Ornaments): Consider markdowns or promotional pricing to clear slow-moving stock.
Double Down on Online Fulfillment Prioritize online channel logistics, as it dominates order volume.
Sales Performance
Leverage High-Growth Months: Use May’s growth drivers as a template for future months. Create targeted offers during slow months (Feb, Apr) to reduce revenue dips.
Scale Midwest Success to Other Regions: Apply best practices to the South, which has the lowest performance.
Focus on Top Product Categories: Continue to push Decoratives, as they generate the highest revenue. For Electronics (weak performer): Explore bundling strategies with top sellers.
Enhance Sales Channels: Invest more in online sales, as it’s the top revenue generator. For in-store and wholesale: Offer bulk incentives to wholesale buyers.
Replicate High Performer Behaviors Across Sales Team
Conclusion
The analysis highlights clear opportunities to strengthen both inventory management and sales performance. On the inventory side, aligning stock levels with regional demand and seasonal trends is critical to avoid stockouts and reduce excess holding costs. At the same time, doubling down on high-performing products and optimizing fulfillment for the dominant online channel will help sustain growth.
From a sales perspective, the Midwest’s success offers a blueprint for boosting underperforming regions, while the strong performance of decorative products and online channels underscores where future investments should be focused. Addressing seasonal dips through targeted promotions and leveraging top-performing sales talent can further drive consistency and profitability.
By implementing these insights and recommendations, the business can not only maintain its current momentum but also unlock new avenues for efficiency, customer satisfaction, and sustainable revenue growth.
Like this project
Posted Sep 17, 2025
In this project, I set out to uncover the dynamics shaping sales and inventory efficiency.
Likes
1
Views
3
Timeline
Sep 3, 2025 - Sep 5, 2025