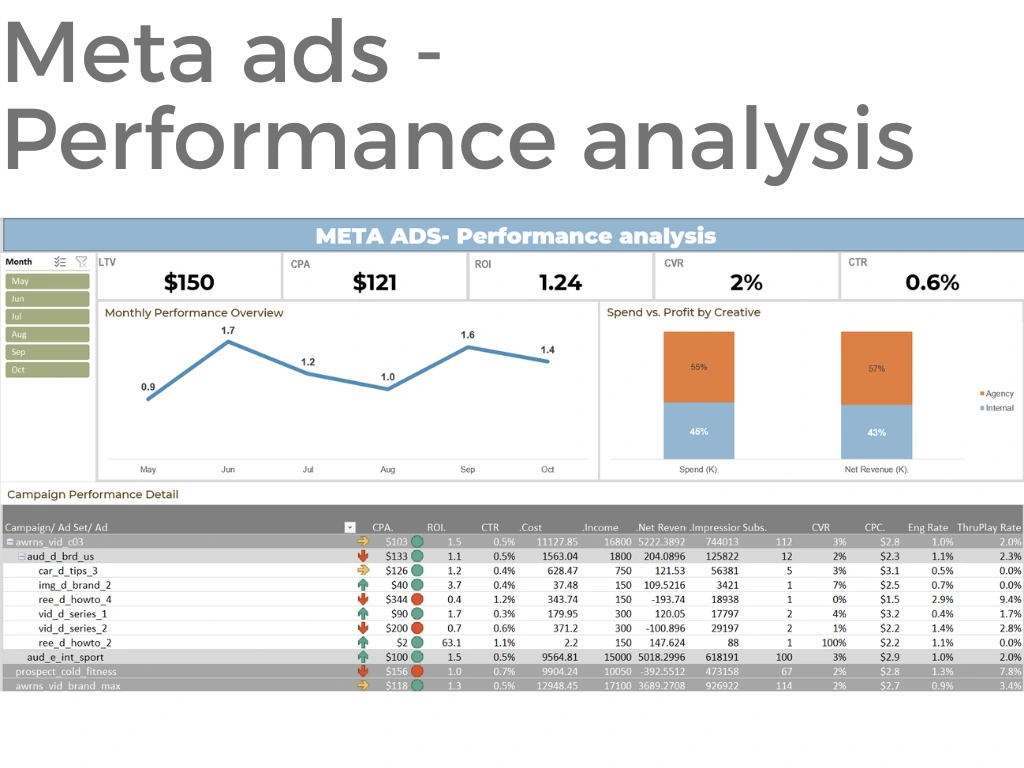
Meta Ads - Performance Analysis
Sara Baptista
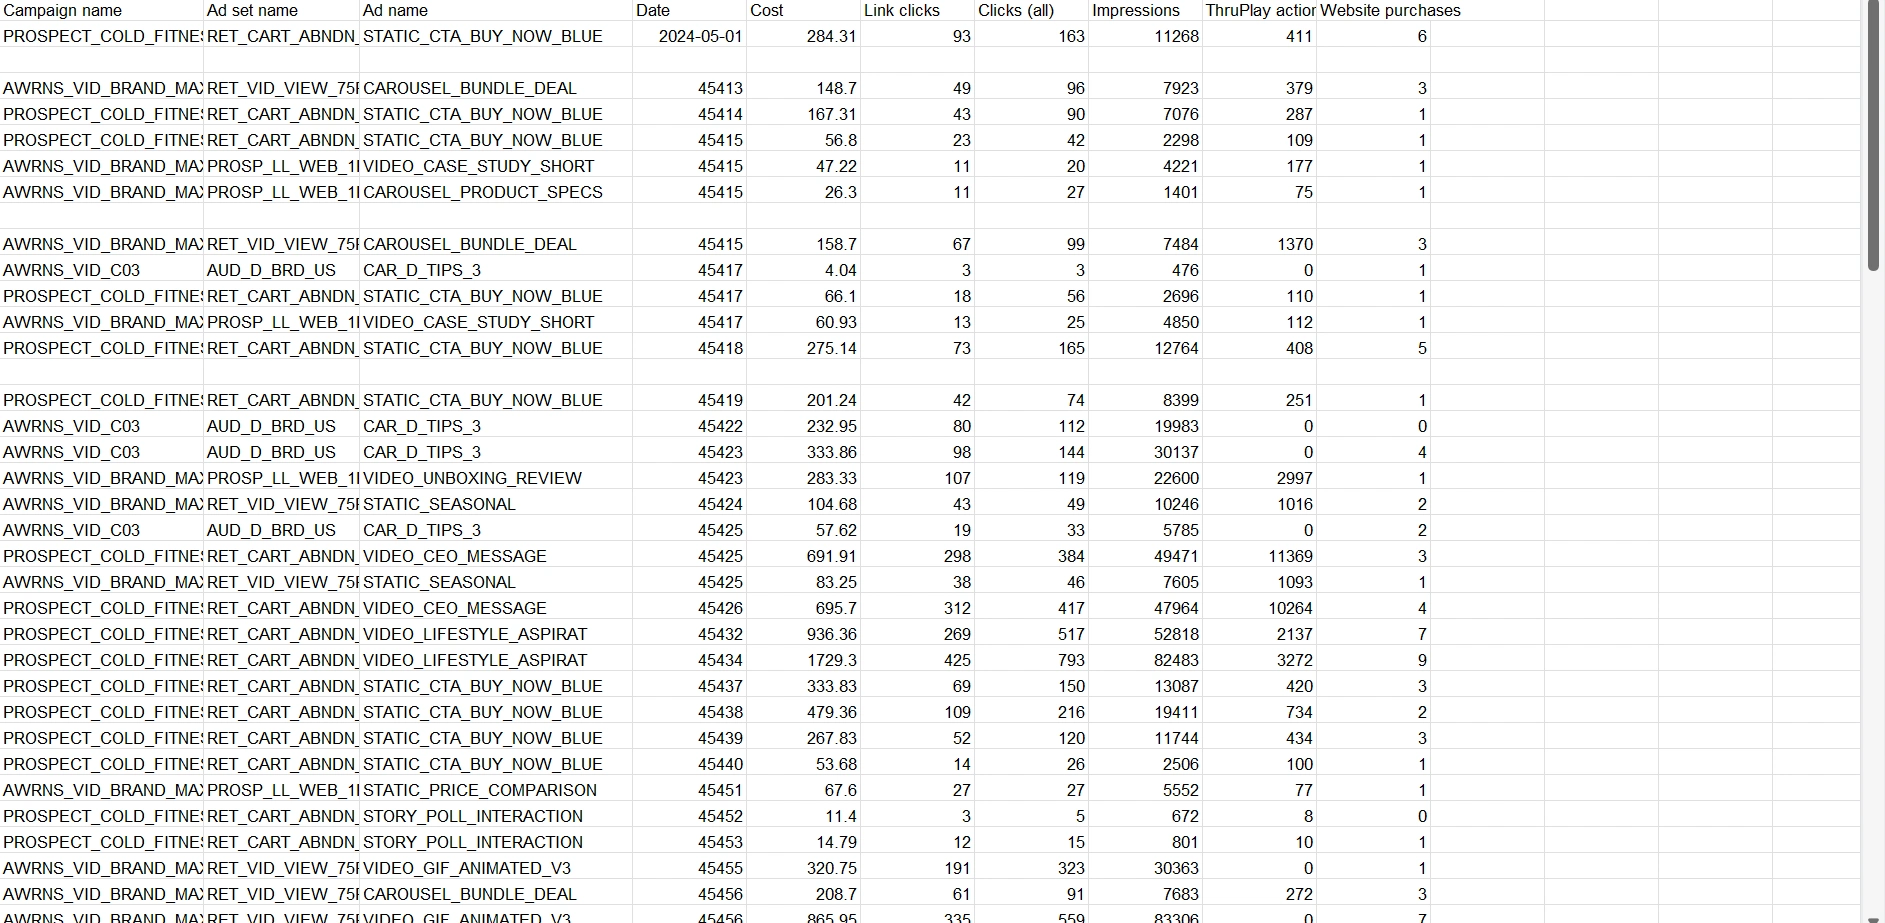
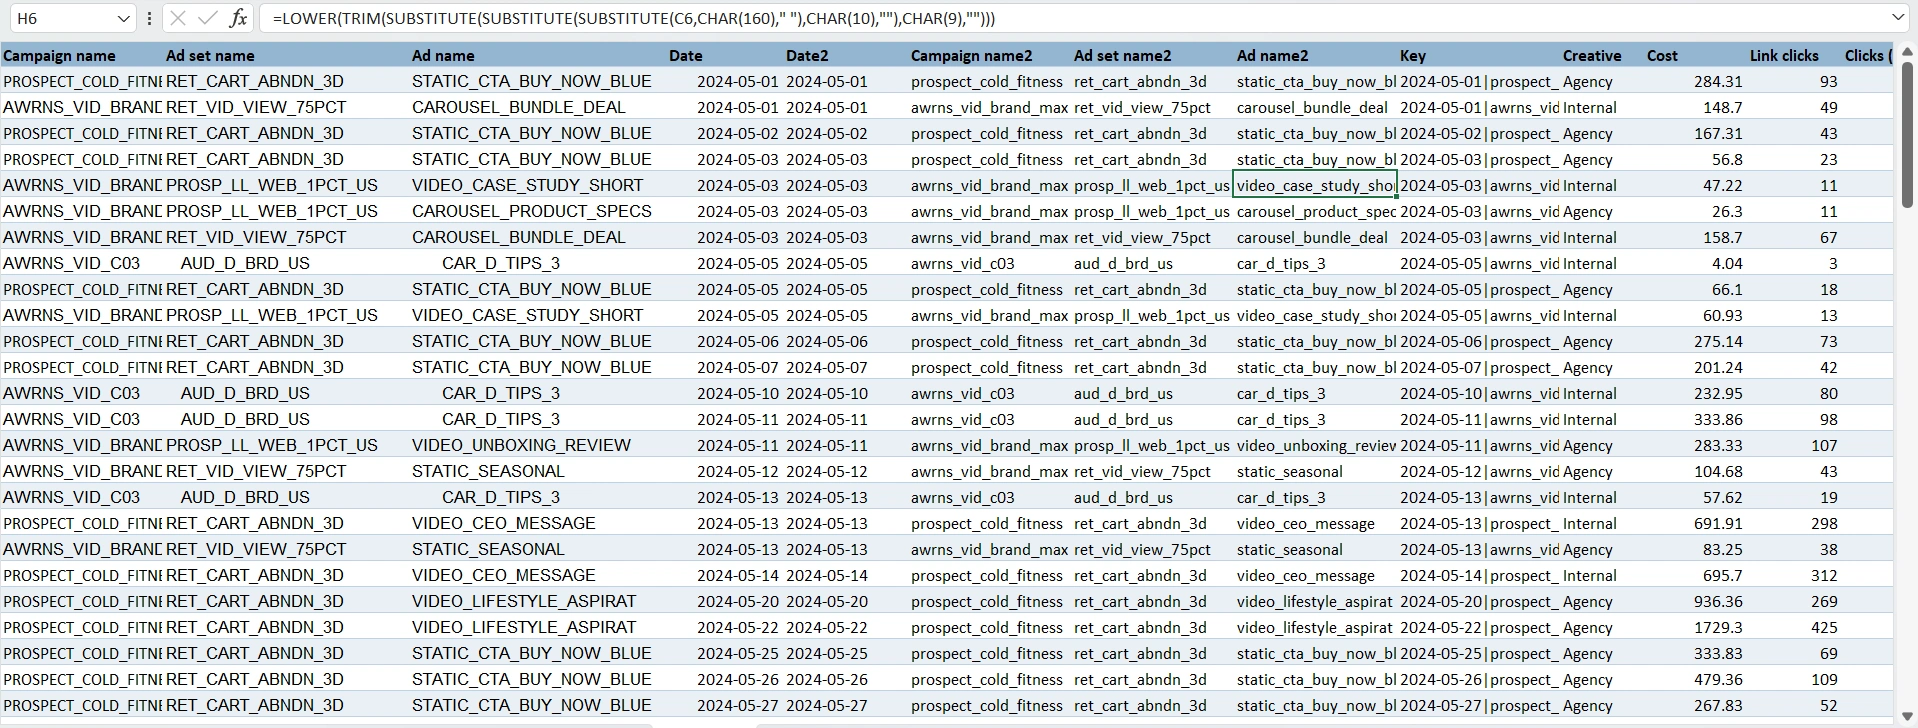
The project started with a raw, exported mess of campaign metrics. It had all the right numbers—costs, clicks, and performance indicators—but they were stuck in a format that was impossible to use for quick decision-making.
I started by cleaning and merging the raw data using Excel formulas to get everything into a structured, reliable format.
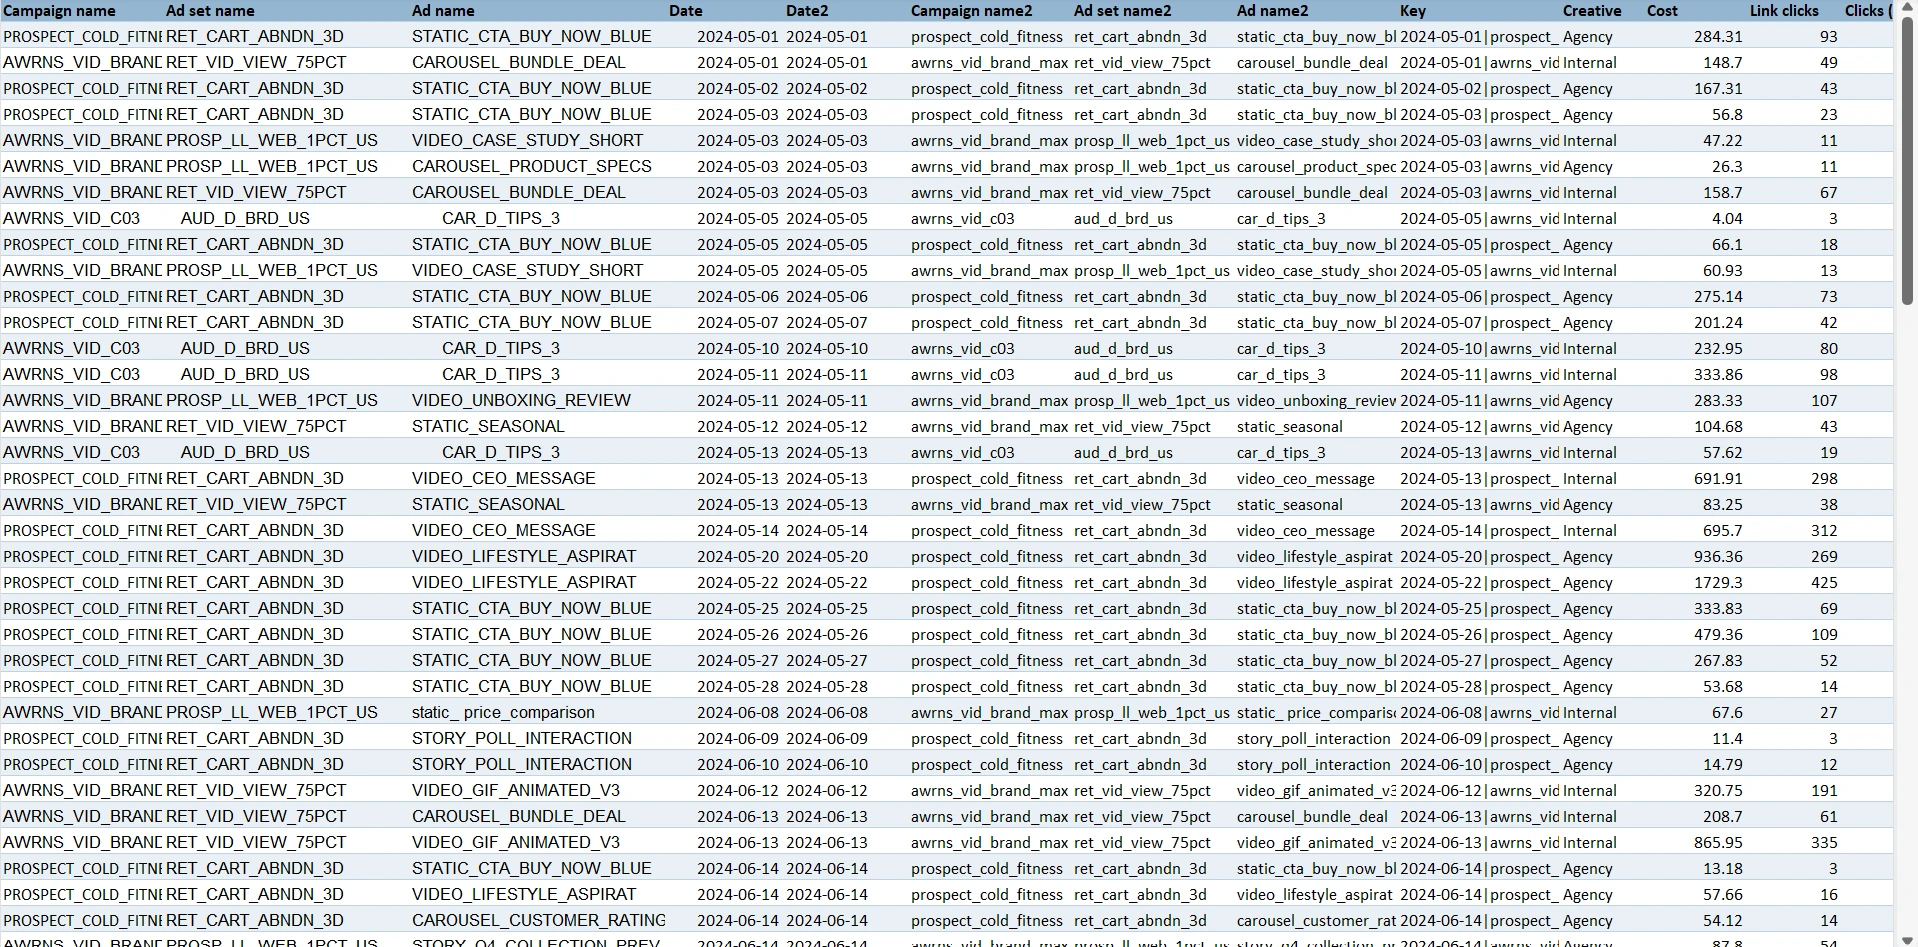
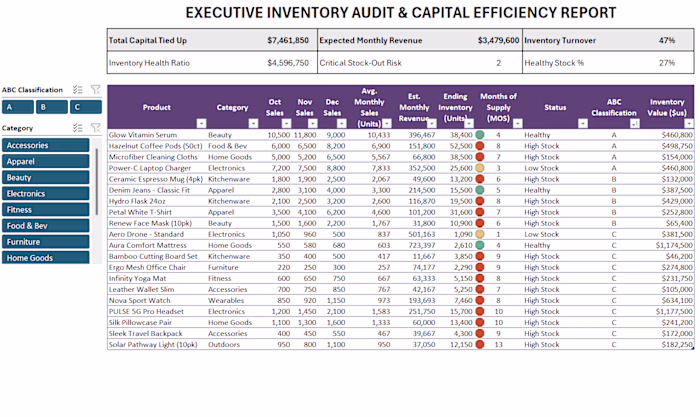
Once the data was clean, I used Pivot Tables and Calculated Fields to go beyond simple costs. I wanted to see the real story behind the CPA and ROI.
I built an interactive dashboard with a "traffic light" system using conditional formatting. This way, instead of scrolling through hundreds of rows, you can see the high-performing winners and the "money burners" instantly.
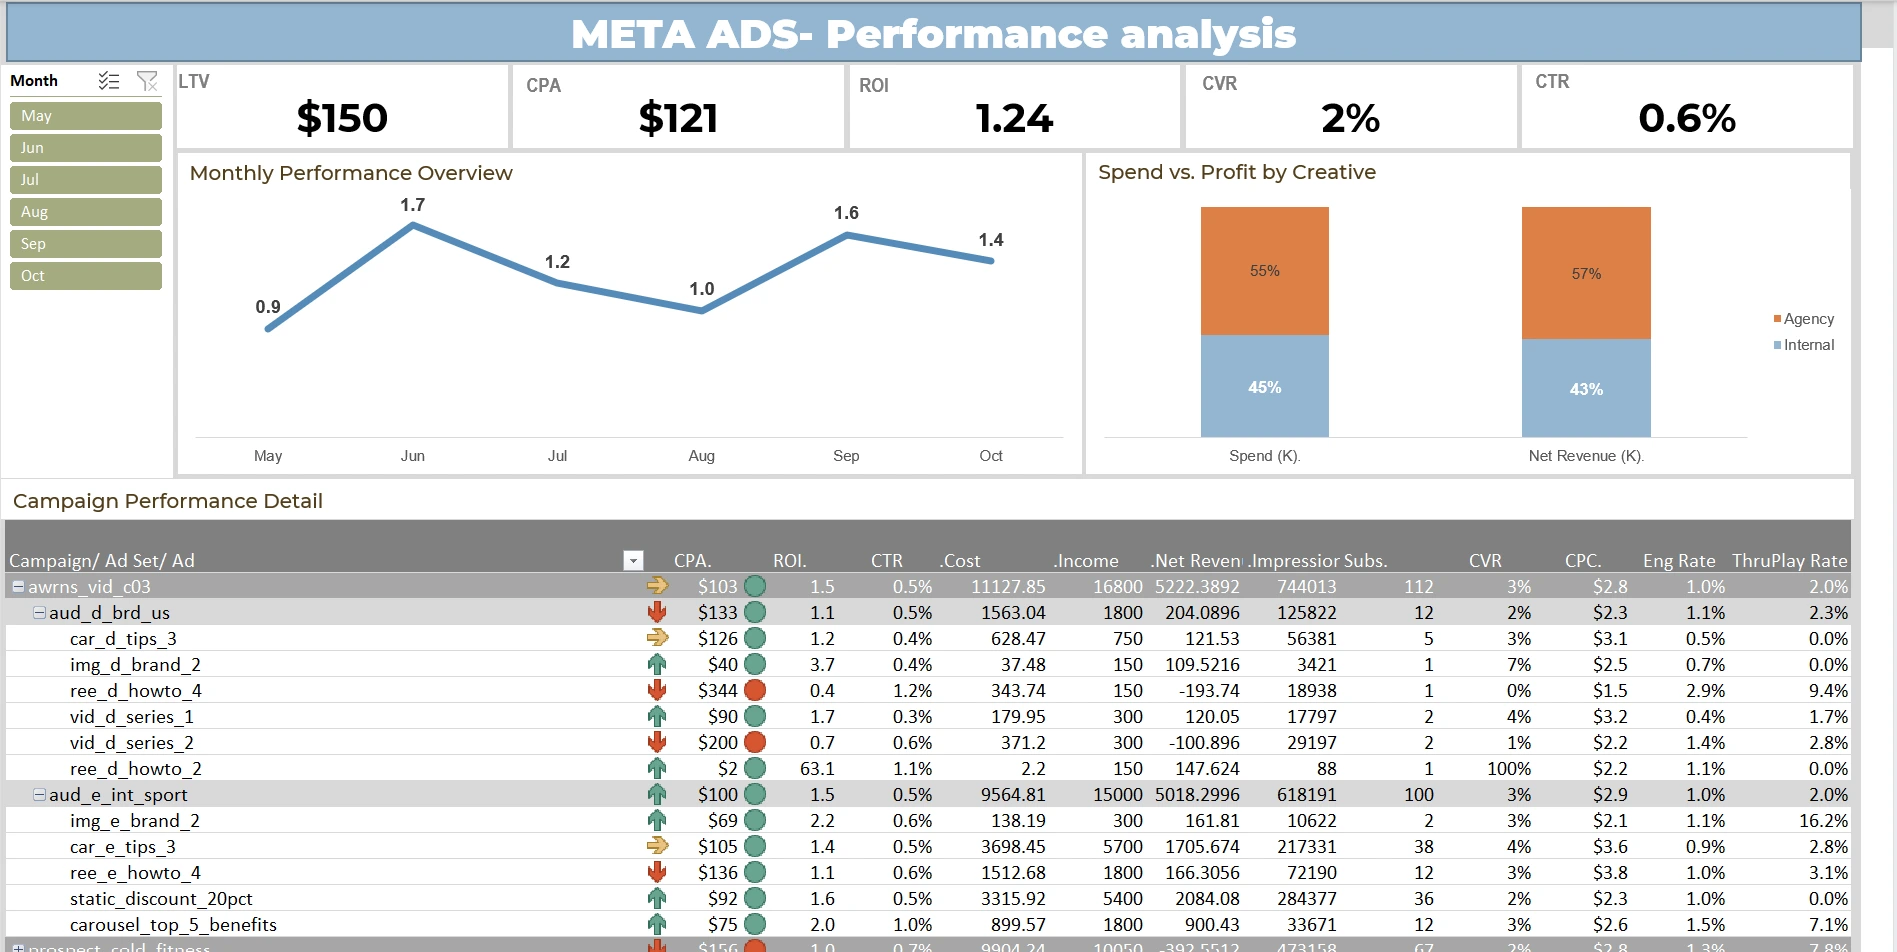
By shifting the focus to Net Revenue and actual profitability, we identified exactly which campaigns were worth scaling and which ones needed to be cut immediately to save the budget.
Like this project
Posted Jan 5, 2026
Cleaned messy ad exports to build a custom ROI tracker. I used Excel to find which campaigns were losing money and reallocated budget to the winners.