
Sara Baptista
Excel Expert | Data Cleaning, Dashboards & Reports
Ready for work
Sara is ready for their next project!
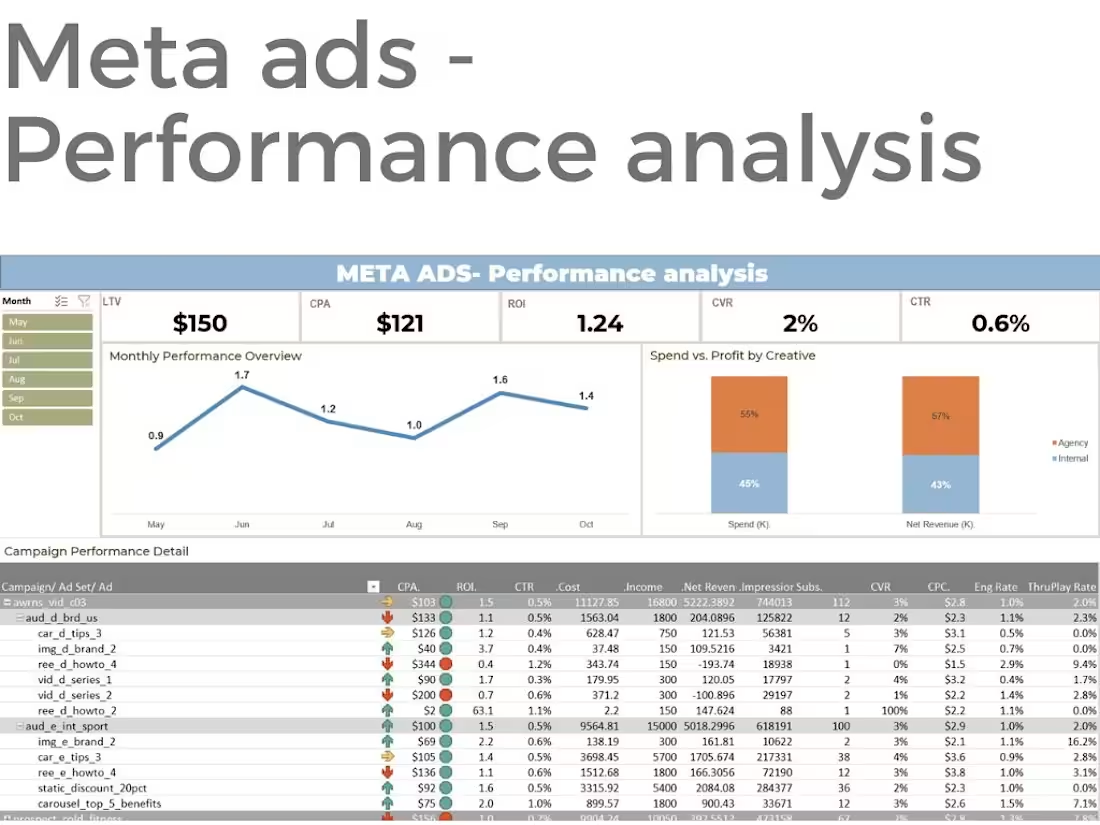
Meta Ads - Performance Analysis
0
3
New year, new clarity. 📈
I designed this mobile layout to show how easy it is to keep your business’s key metrics right in your pocket. For any business, starting 2026 with real-time performance data is the difference between guessing and growing.
The goal: Clear, actionable, and mobile-optimized insights from Day 1.
What do you think about this layout for tracking your goals this year? 📱
21
217
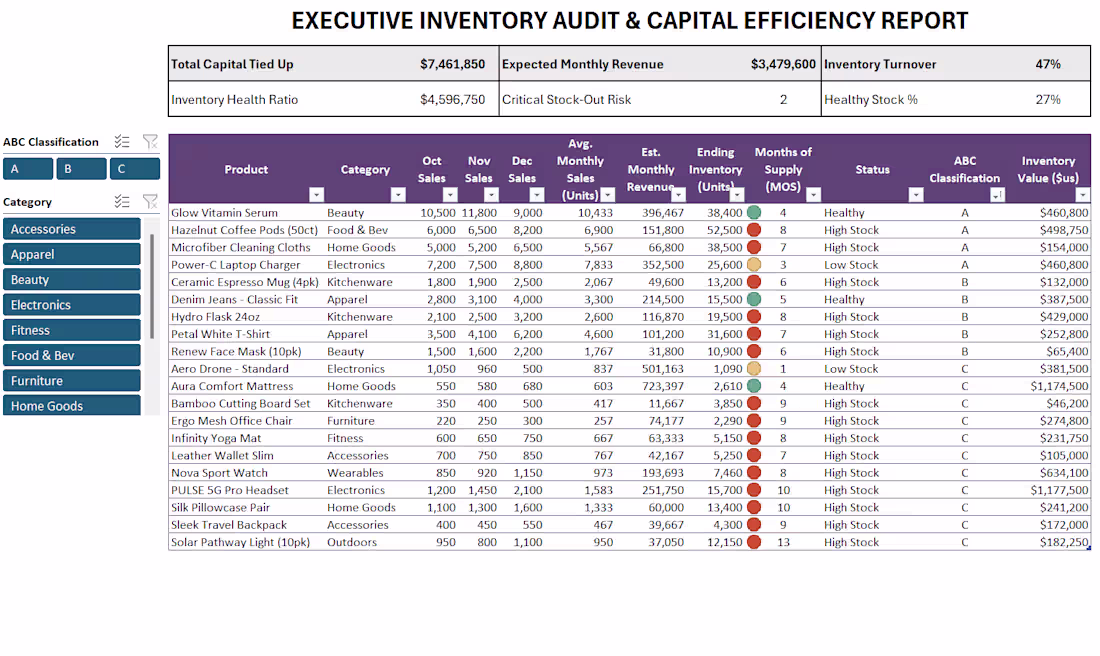
Finding Powerful Insights in a Simple Report
You don’t need complex software to see the "hidden" story behind the numbers. Using standard Excel formulas (VLOOKUP, SUMIF, AVG), I turned a messy SKU list into a clear Inventory Report that reveals exactly where money is being lost.
Three key insights from this Inventory Report:
⚠️ The Capital Trap: We have $7.4M tied up in stock, but $4.5M of that is "frozen" in slow-moving items.
🚨 Revenue at Risk: We’re risking $350K in monthly sales because we're stocking the wrong items.
📊 The Efficiency Gap: Only 27% of our inventory is "Healthy." The rest is either dangerously low or excessively high.
This report is about moving from "guessing" to "knowing." By cleaning the data and adding simple Slicers, we created a tool that protects revenue and optimizes Cash Flow.
12
212
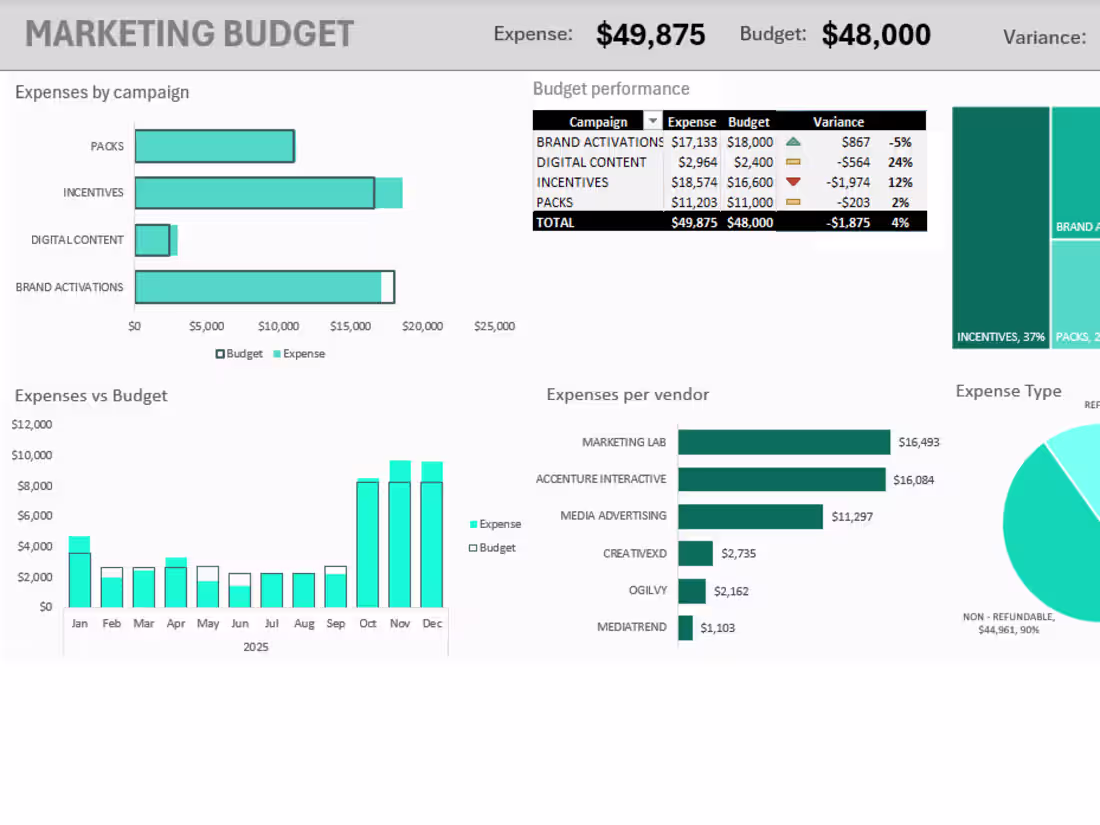
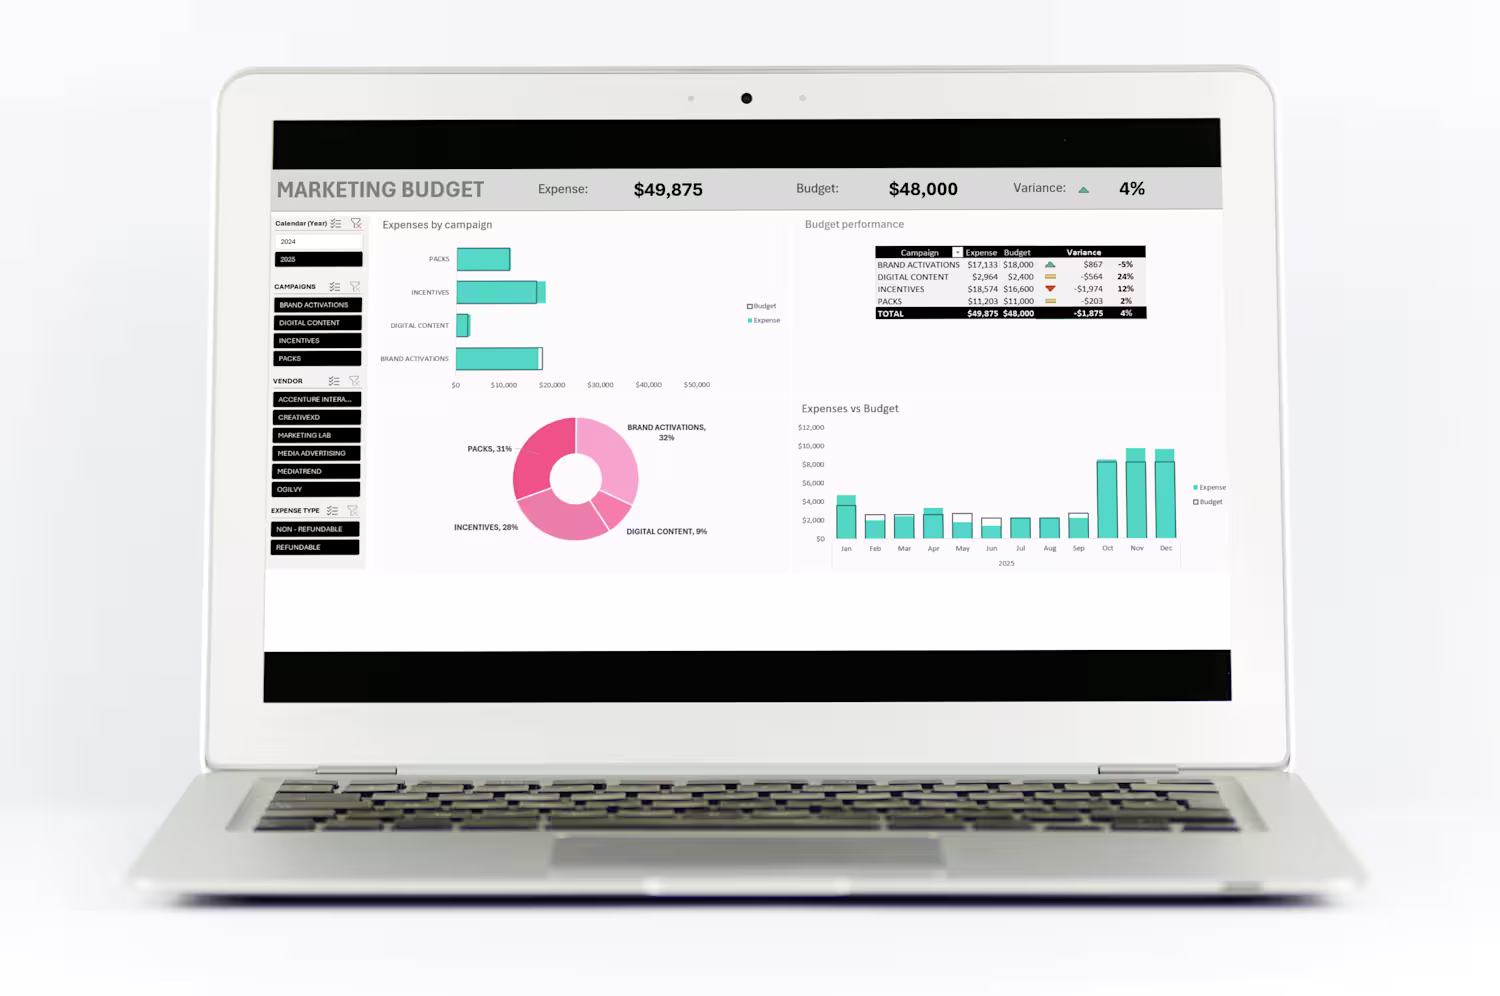
From Chaos to Clarity: MARKETING BUDGET ROI DASHBOARD📊
The Challenge: Manual budget tracking resulted in zero visibility. Budget was overspent by $1,875 (3.91%)🚩; the client lacked actionable insight on spending.
The Solution: Implemented a dynamic Excel dashboard for real-time oversight and Data Visualization. Key insights:
🛑Critical Overspend: Flagged Digital Content (23.5% over) and Incentives (11.9% over).
Reallocation: Identified Brand Activations (4.8% under), allowing $867 reallocation.💰
Cash Flow: 📉 Highlighted chaotic spikes in Jan (+29.9%) and Apr (+26.8%).
The Outcome & Next Step: Client has a one-click system for strategic decisions.🚀 Next step: Merge expense data with sales to calculate Net ROI and drive profitability.
5
22
297