Finding Powerful Insights in a Simple Report You don’t need ...
Sara Baptista
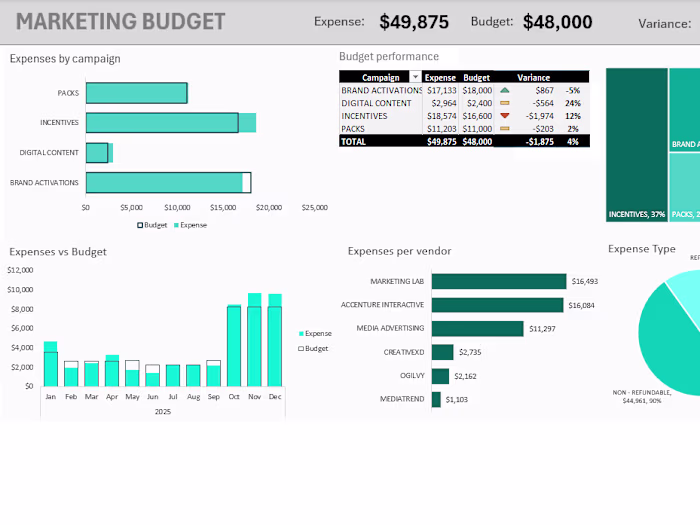
Finding Powerful Insights in a Simple Report
You don’t need complex software to see the "hidden" story behind the numbers. Using standard Excel formulas (VLOOKUP, SUMIF, AVG), I turned a messy SKU list into a clear Inventory Report that reveals exactly where money is being lost.
Three key insights from this Inventory Report:
⚠️ The Capital Trap: We have $7.4M tied up in stock, but $4.5M of that is "frozen" in slow-moving items.
🚨 Revenue at Risk: We’re risking $350K in monthly sales because we're stocking the wrong items.
📊 The Efficiency Gap: Only 27% of our inventory is "Healthy." The rest is either dangerously low or excessively high.
This report is about moving from "guessing" to "knowing." By cleaning the data and adding simple Slicers, we created a tool that protects revenue and optimizes Cash Flow.
Like this project
Posted Dec 30, 2025
Finding Powerful Insights in a Simple Report You don’t need complex software to see the "hidden" story behind the numbers. Using standard Excel formulas (VLO...