Data Analysis & Visualizations
Amanda Miller
Data Management
Managing large datasets including scientific, financial, demographic, and other data types. Tasks regularly include cleaning, formatting, organizing, and analyzing data using Excel, Airtable, and databases.
Data Visualizations
Creating visualizations for dashboards as well as charts used for print media as well as websites and . Also used Tableau and MS PowerBI to build and share dashboards and visualizations.
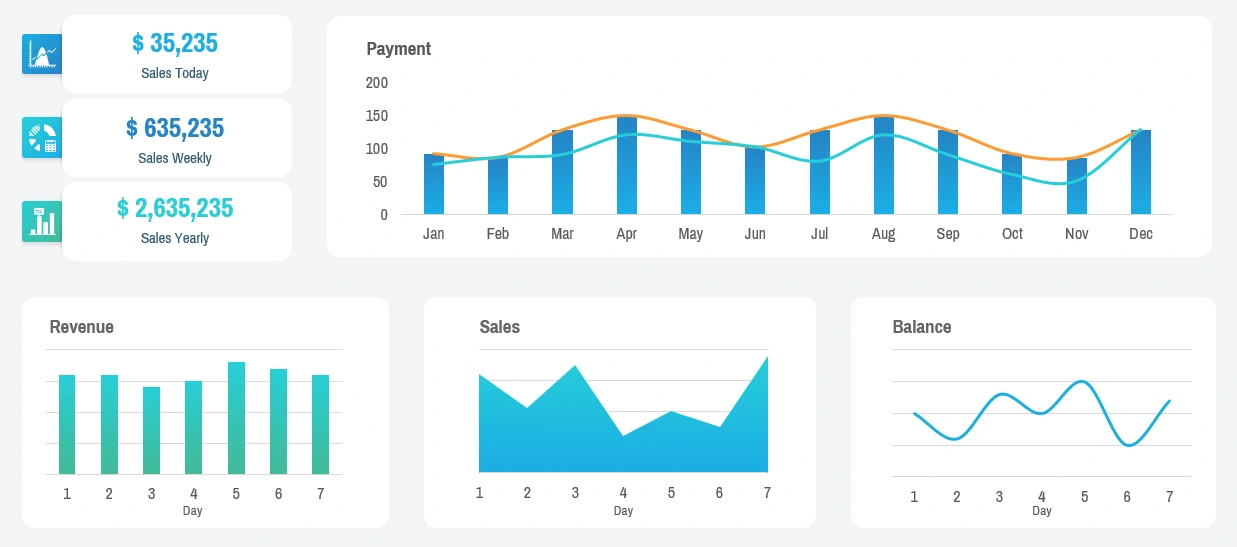
dashboard for revenue and sales
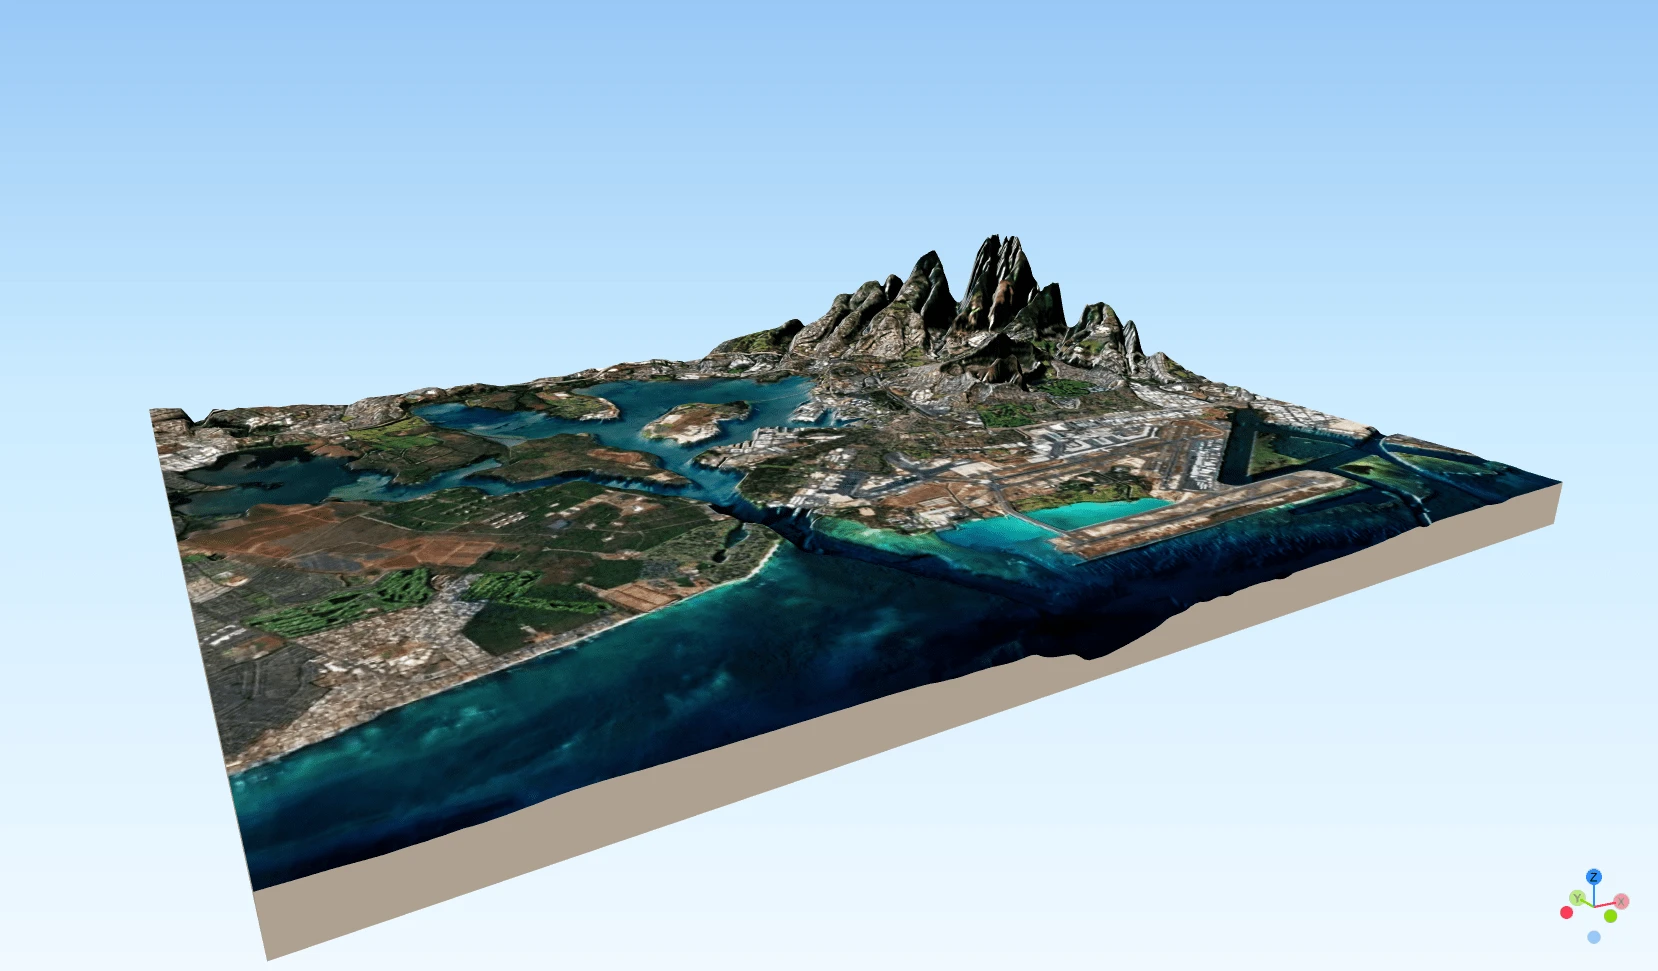
3d model for spatial analysis
Like this project
Posted Feb 22, 2022
Research, clean, manage, and analyze data for use in further modeling as well as visualizations. Built fully integrated models in Tableau and PowerBI.