Design for the residental management admin panel
About company
Netmore Argon is a dedicated IoT operator that drives digitalization by connecting properties to their property network, provides open access 5G networks to asset owners, and enable massive IoT connectivity by rolling out nationwide LoRaWAN infrastructure.
Task
The goal was to make the design for admin panel for property owners and sensors tracking app that are connected to PropTech Node.
PropTech Node itself is a combination of hardware and software installed in a building. It provides online connectivity for systems, devices and applications available in a building.
I was the visual designer and was responsible for creating a design system with layouts according to the given research. Sometimes I was in charge of user flow and usability testing when the UX researcher wasn’t available.
Contributions
My workflow:
wireframe development
prototyping
visual concept
design system (UI kit)
Problem & Solution
The main objective of the project was to design a user-friendly and intuitive admin panel and mobile app that allows the Netmore to manage and track their IoT devices and sensors in real-time, providing customers with an easy-to-use and efficient solution for monitoring and controlling their IoT devices.
Design Solutions:
Admin Panel: The admin panel was designed to be clean and simple, with a clear hierarchy of information and easy-to-use navigation. The dashboard provides an overview of all the properties, sensors and alarms while the device management section allows the admin to add, remove and configure devices. The analytics and reporting features were designed to be intuitive and easy to understand, providing the provider with the ability to analyze sensor data and make informed decisions.
Mobile App: The mobile app was designed to be intuitive and easy to navigate, with large, easy-to-press buttons and a clean layout. The app provides real-time sensor data, alerts and allows customers to control their devices remotely. The push notifications were designed to be clear and concise, alerting customers of any issues or changes in sensor data.
Overview / admin panel
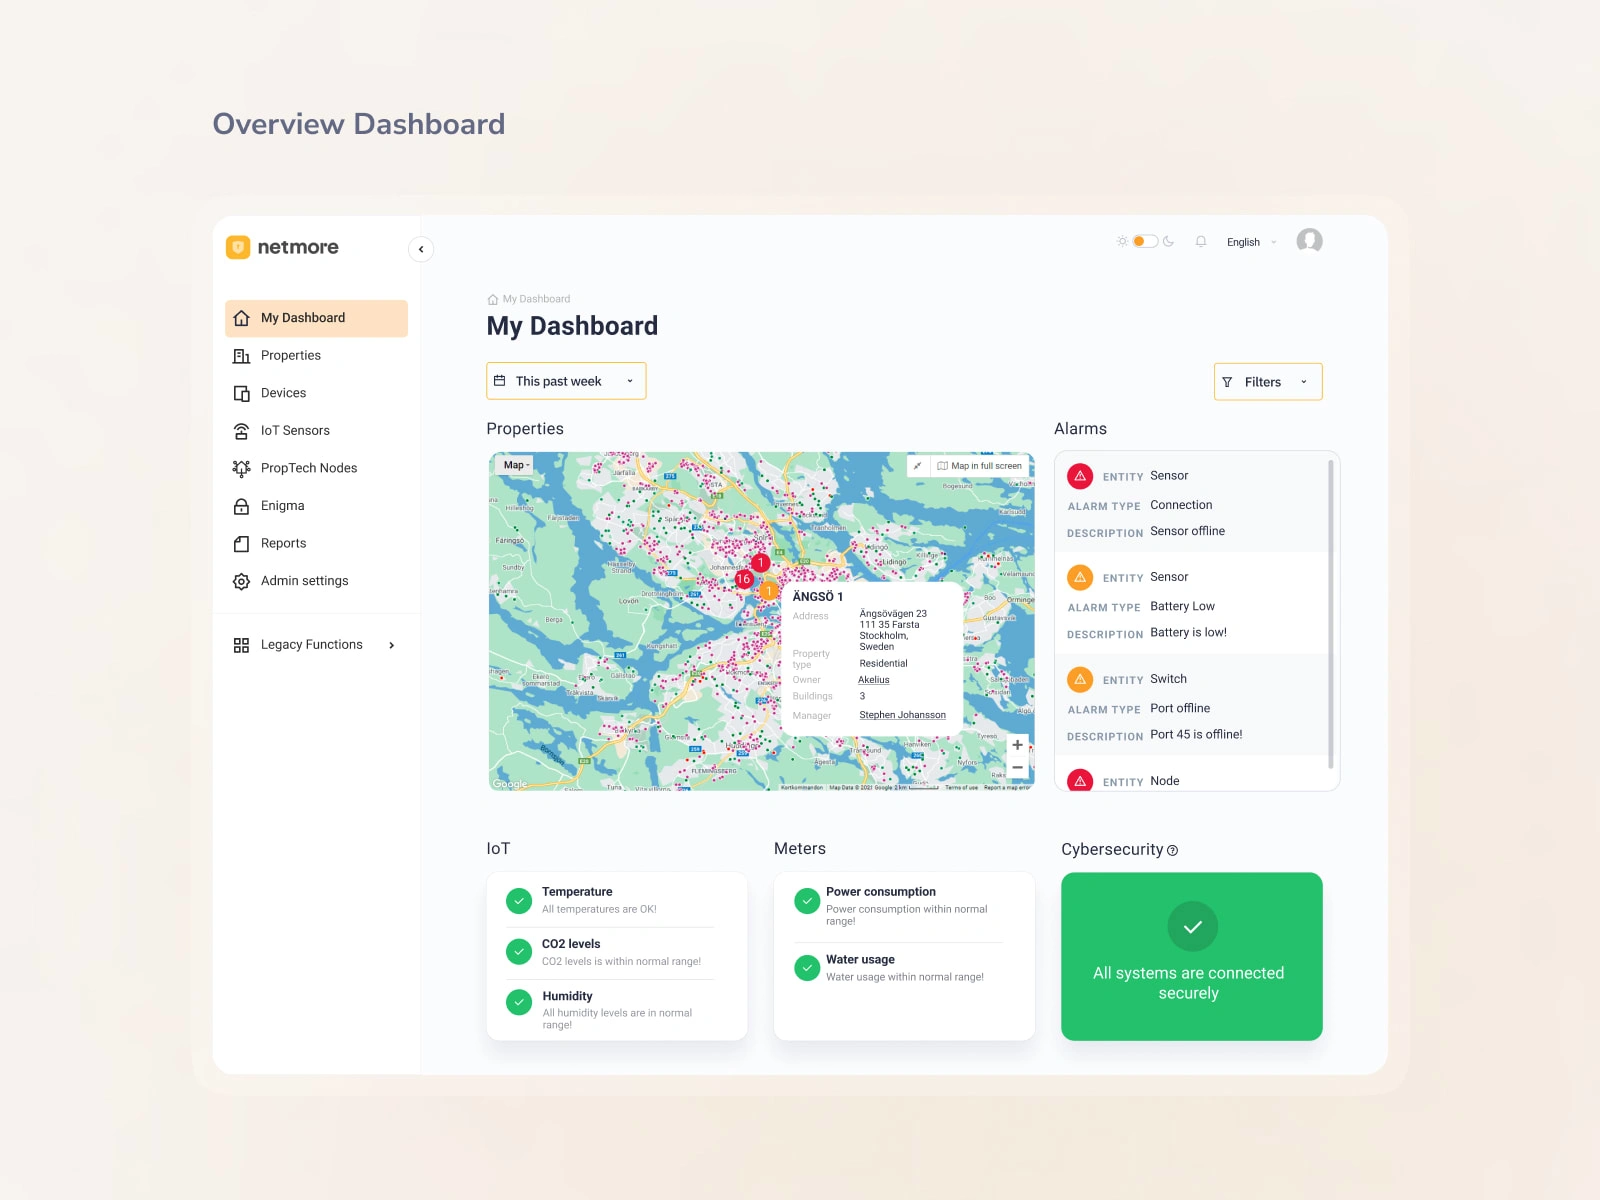
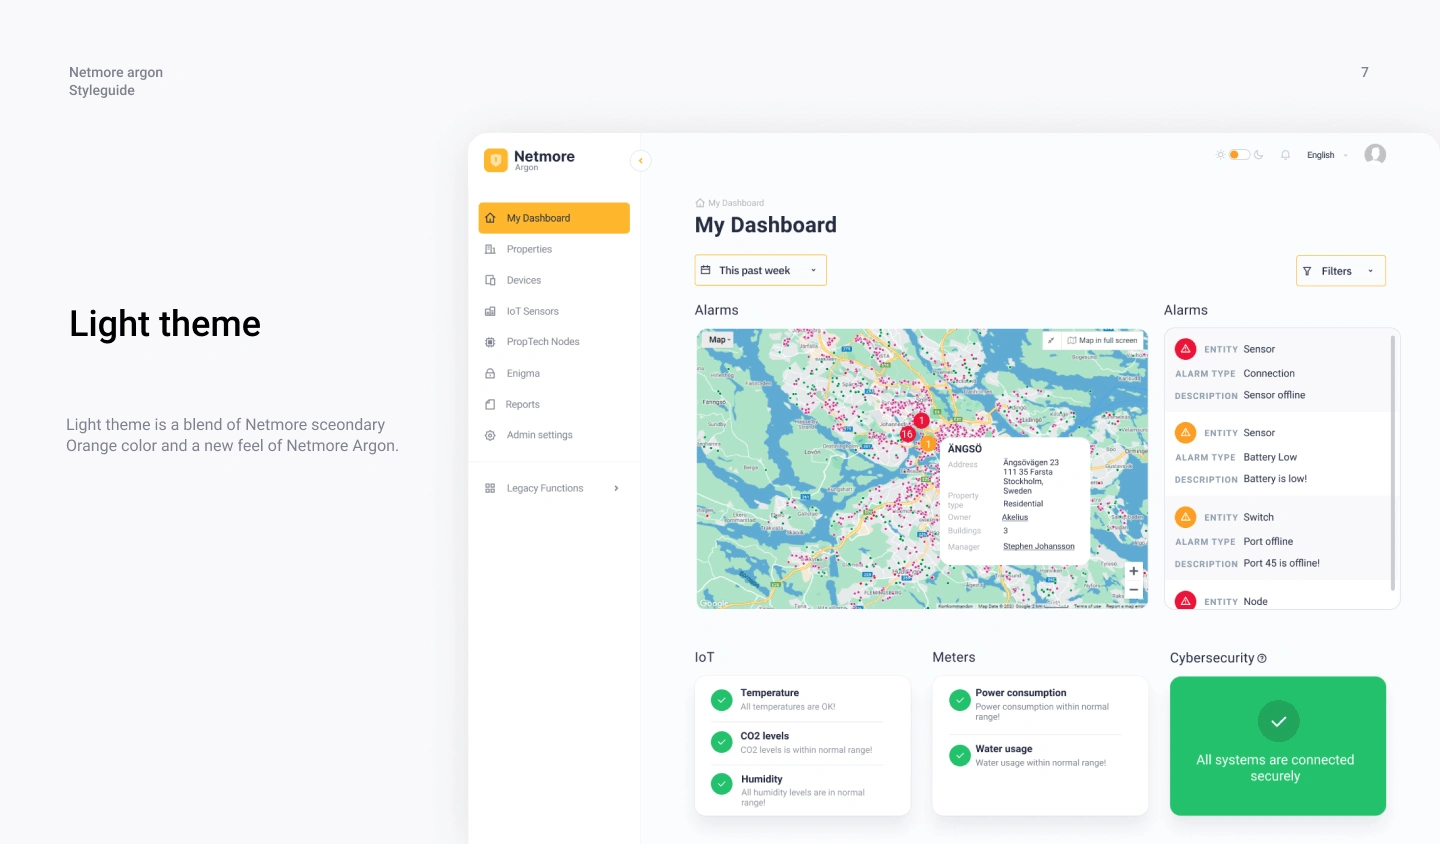
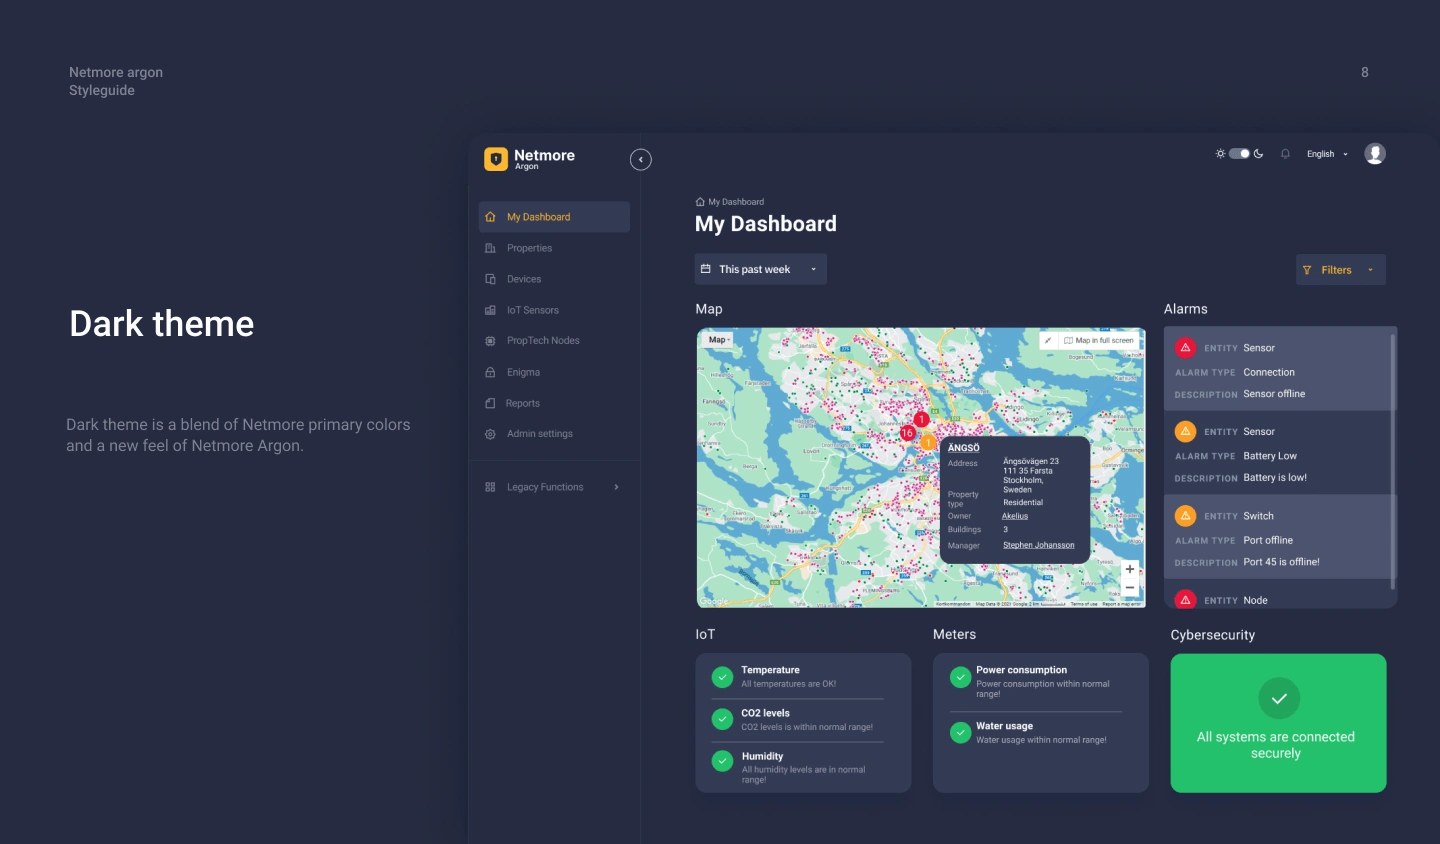
The dashboard is the main hub for the admin panel, providing an overview of all the devices and sensors managed by the admin. The design team focused on creating a clear and simple layout, with a clear hierarchy of information. The dashboard includes the following features:
Properties: A list of all the devices currently managed by admin, including their location, type, building count, owner and manager.
Alarms: A section dedicated to alerts, where the provider can view and manage any alerts generated by the devices.
IoT: A real-time display of sensor data, including temperature, CO2 levels and humidity.
Meters: A real-time display of meter data, including power consumption and water usage
Cybersecurity: Shows the messages for all systems that are connected securely and their errors.
Properties
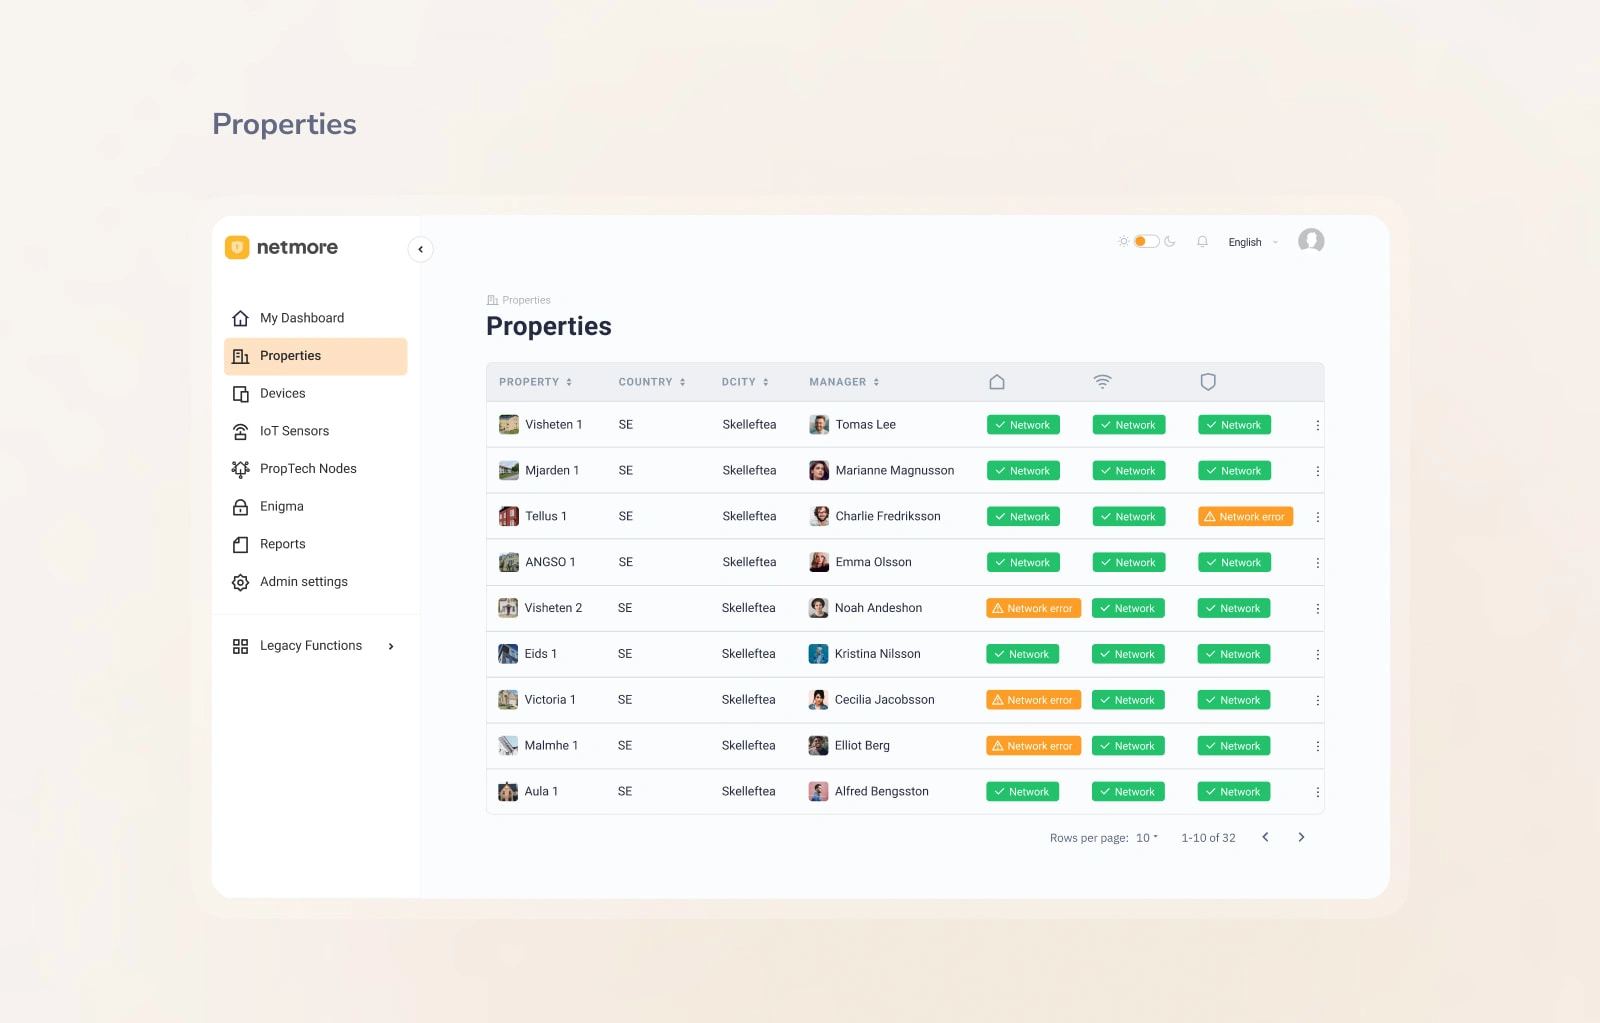
This section allows the admin to manage and track the properties where their devices and sensors are installed. The provider can view the name, location, manager, sensor data, and also configure settings for each property.
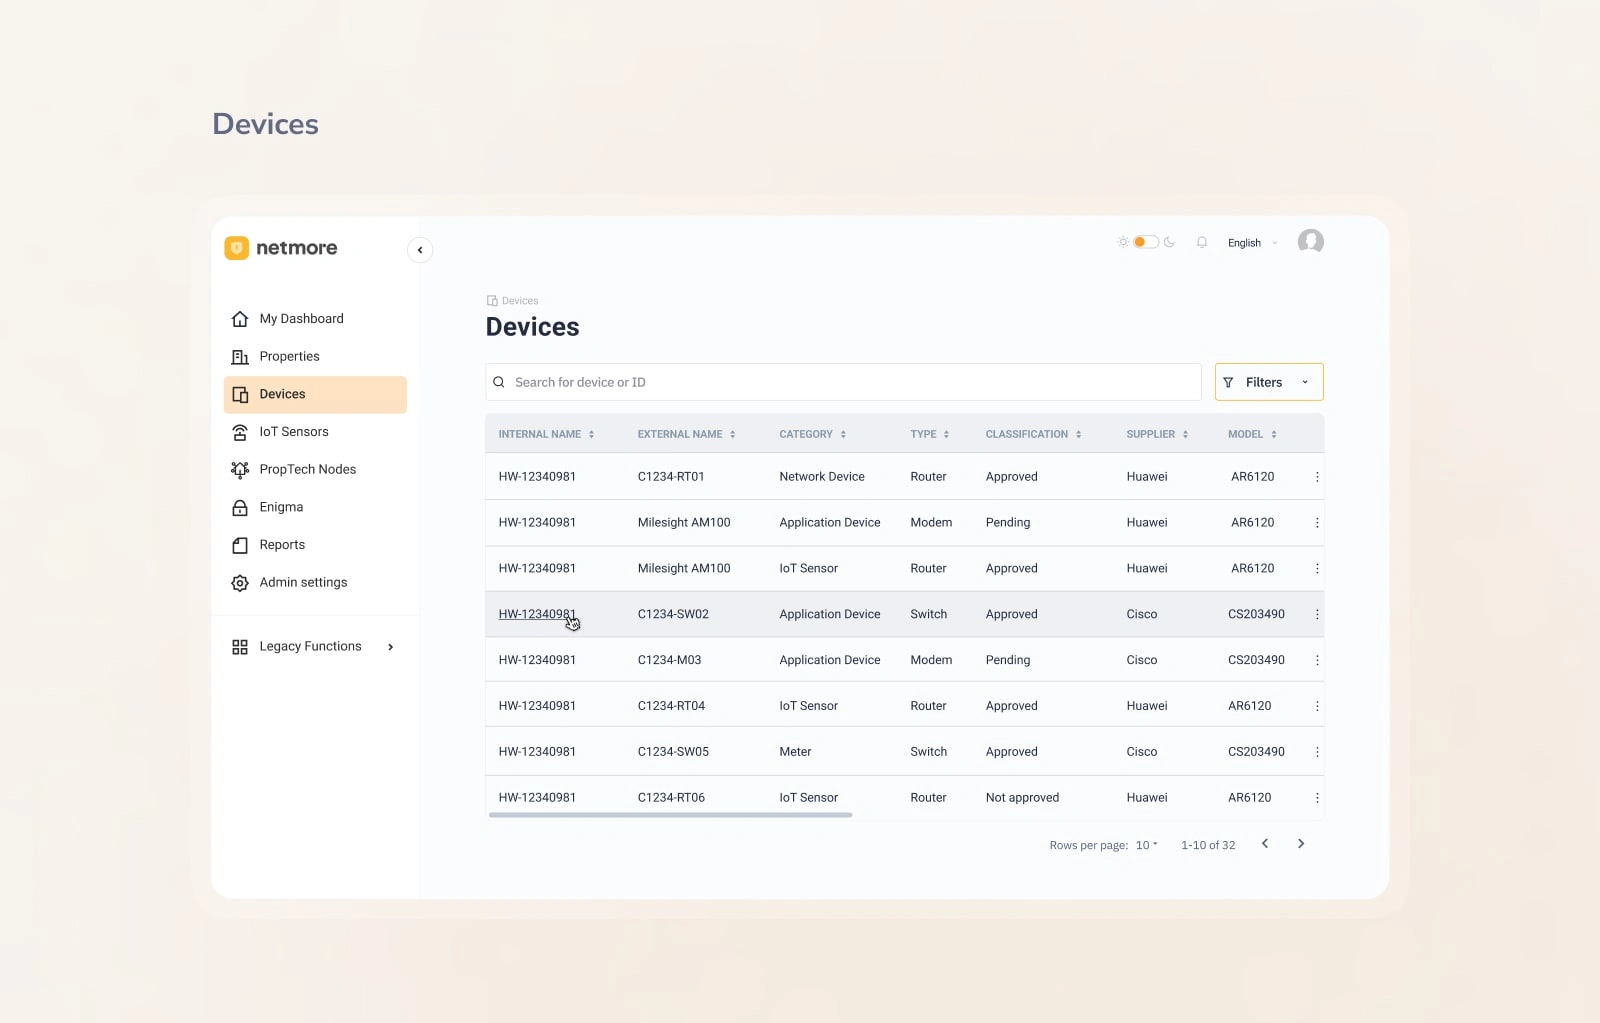
Devices
This section allows the admin to manage their devices, including adding, removing, and configuring devices. The provider can also view the internal name, external name, category, type, supplier, model and configuration of each device.
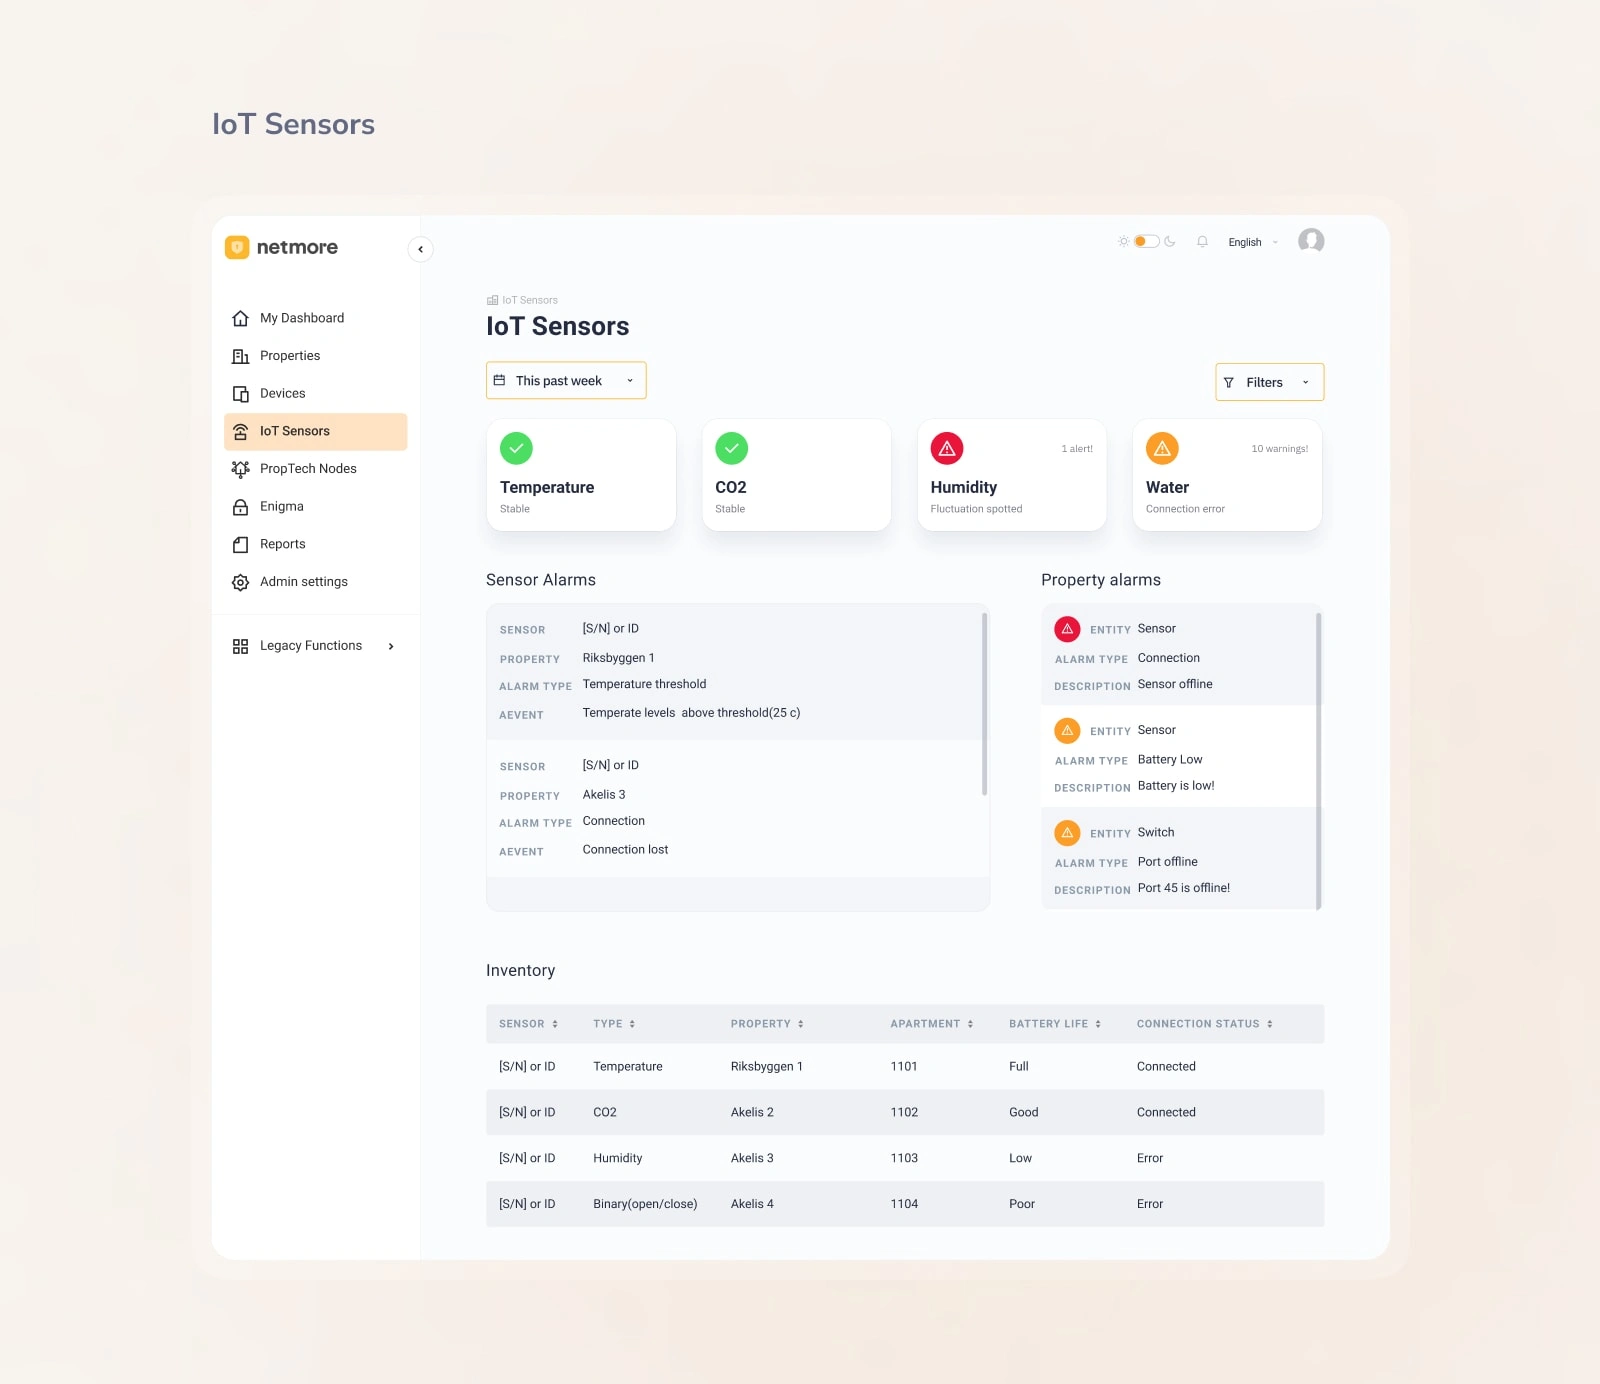
IoT Sensors
This section allows the admin to manage and track the sensors installed on their devices. The admin can view the sensor data in real-time and configure settings for each sensor.
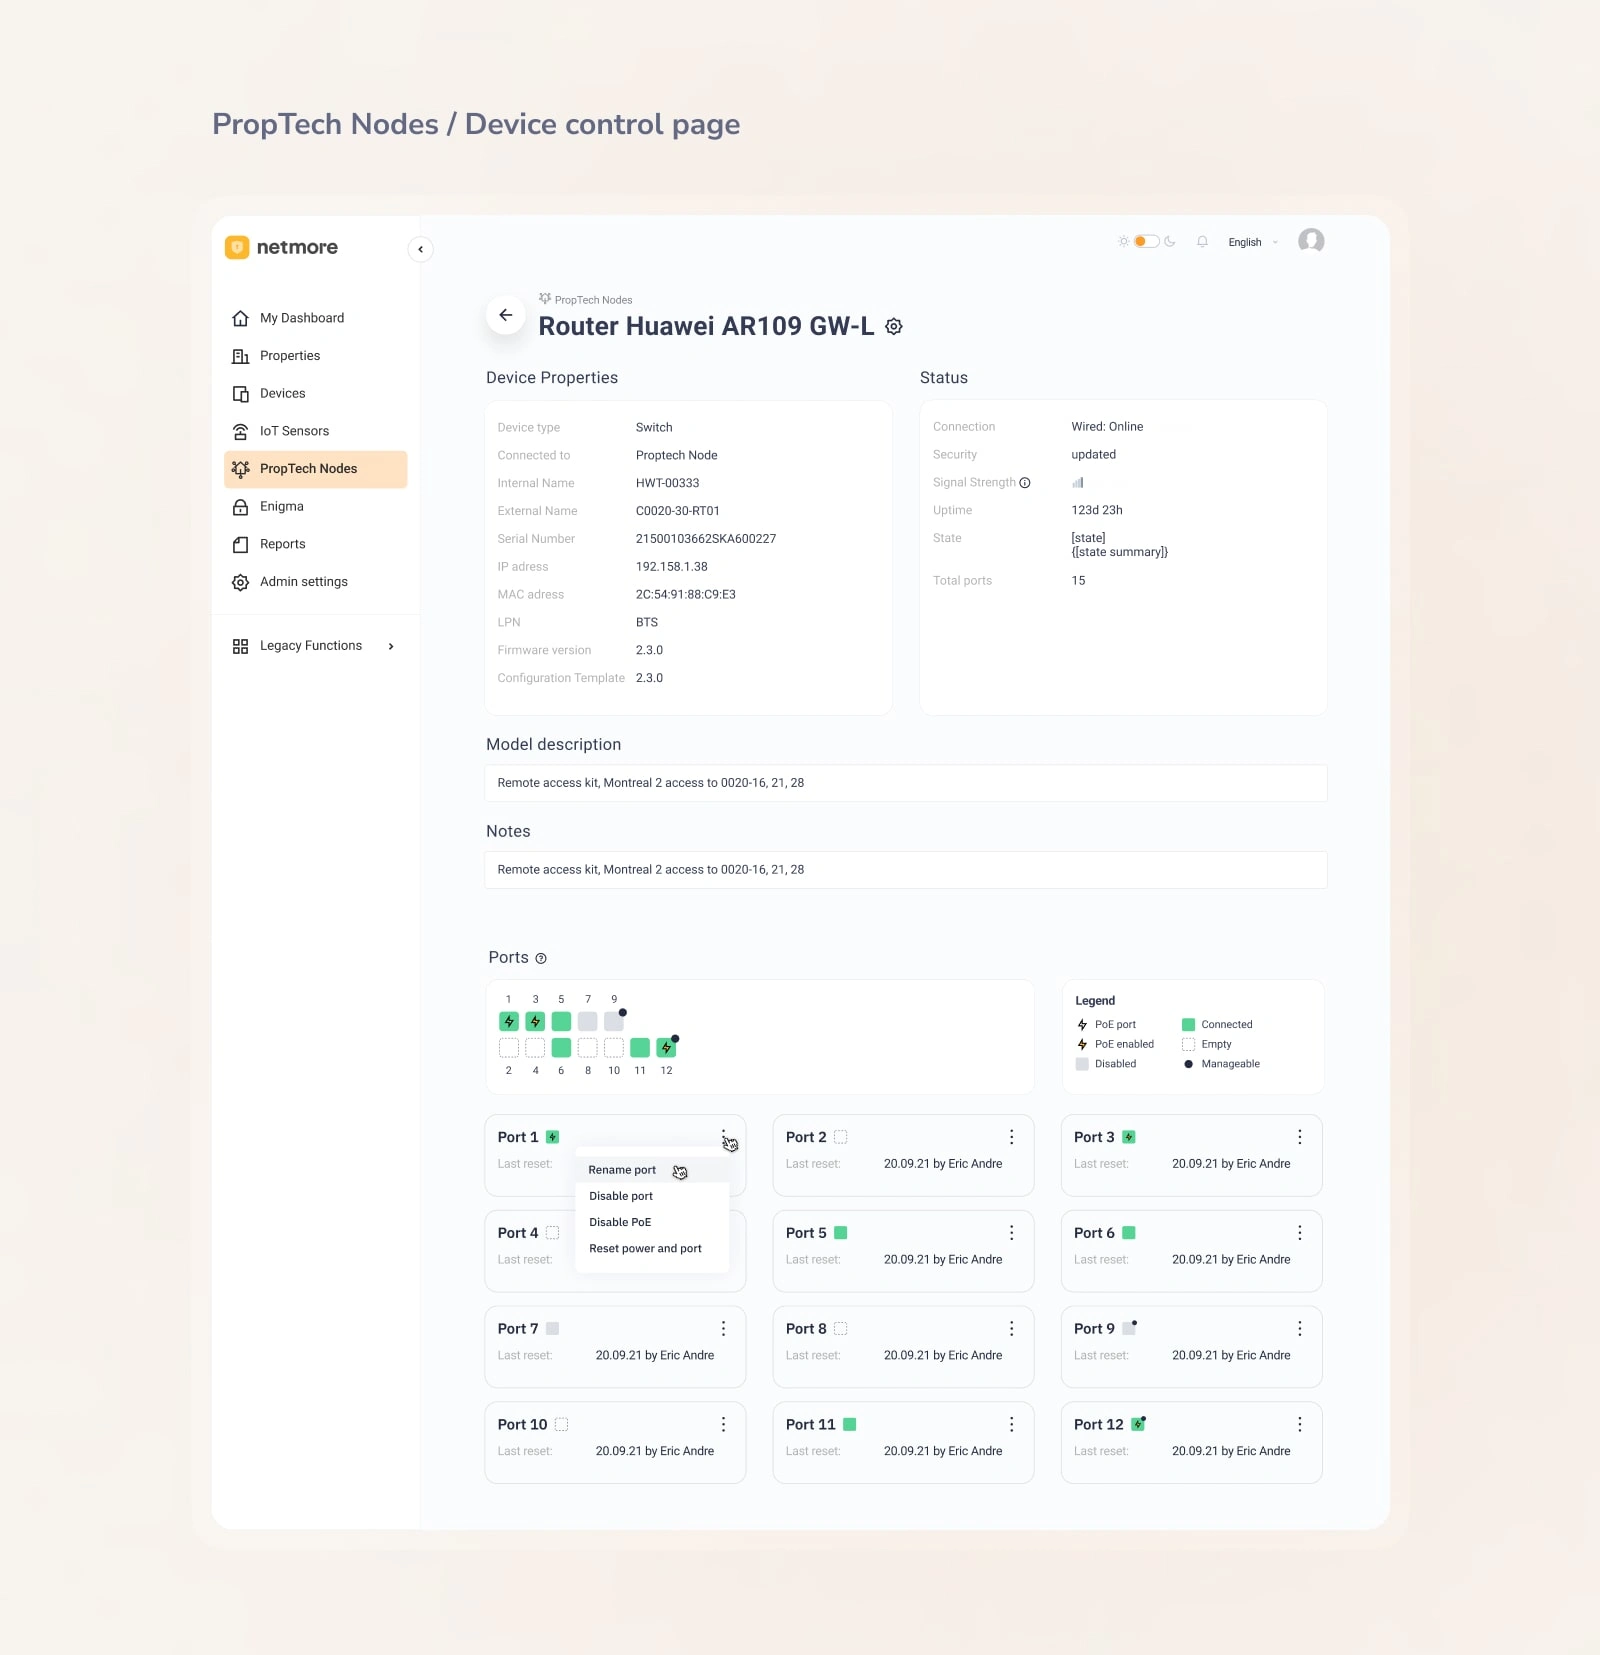
PropTech Nodes
This section allows the admin manage and track the PropTech nodes that are connected to their devices. The provider can view the status, location, alarms, sensor data, and also configure settings for each node.
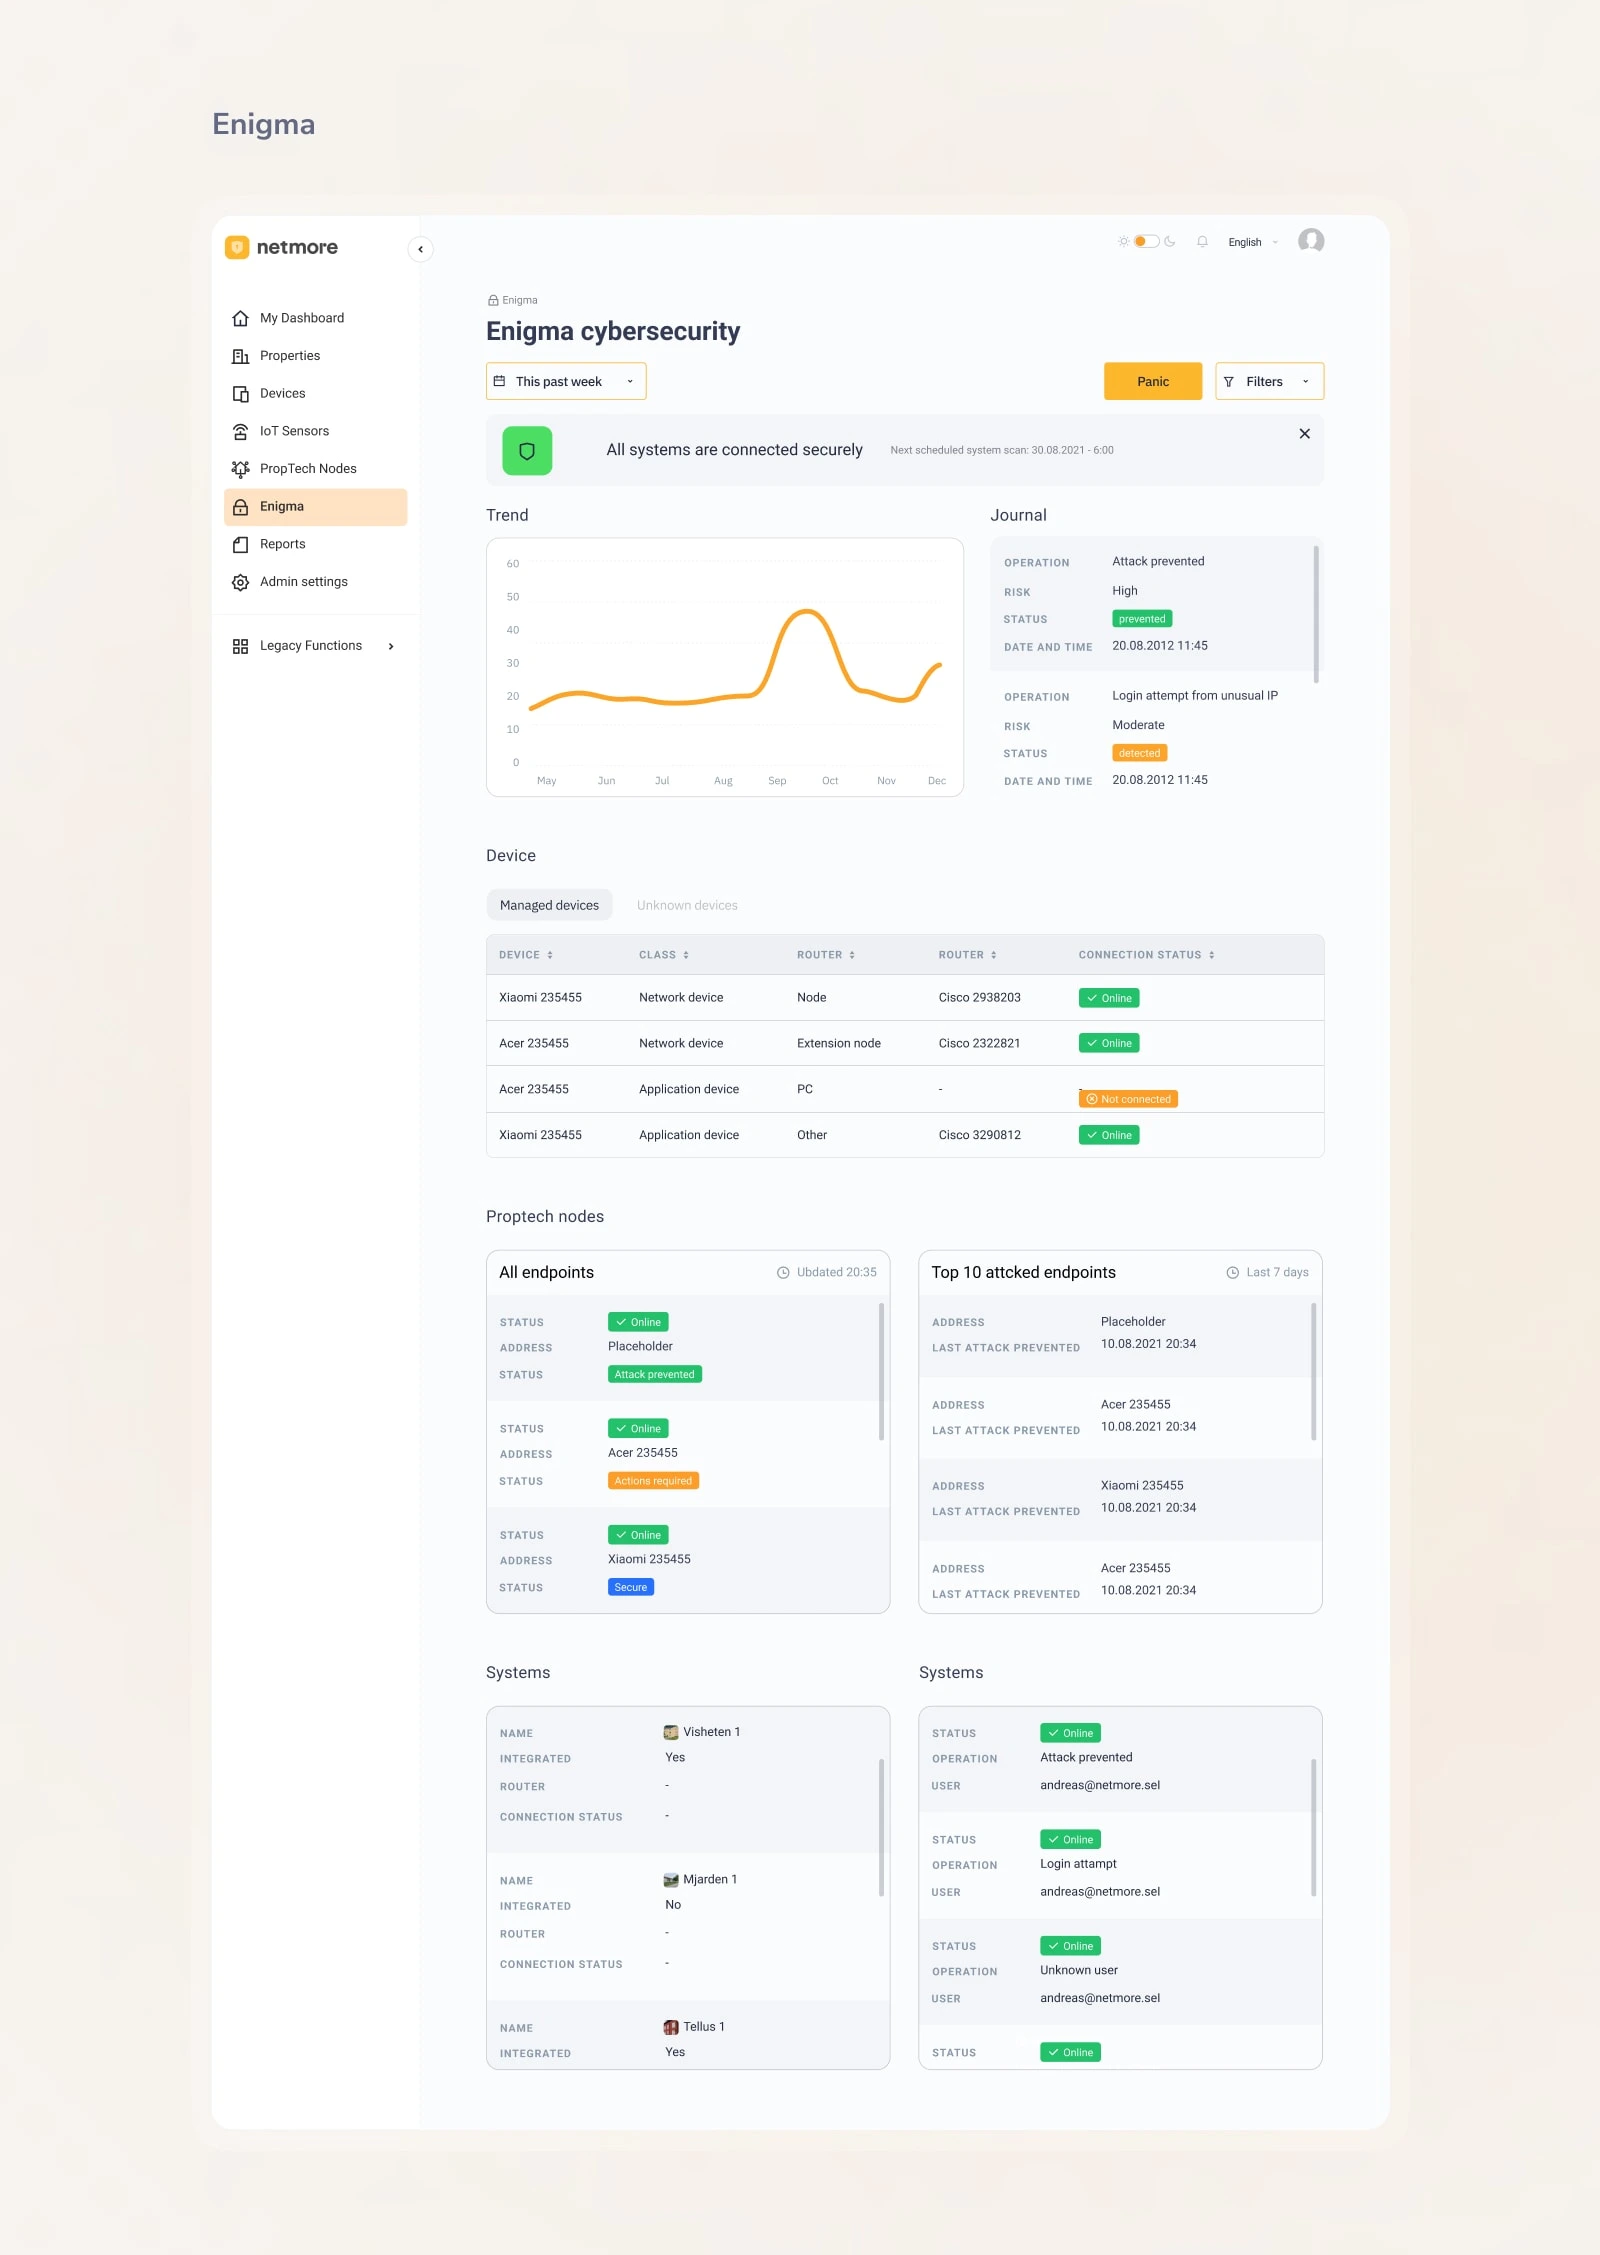
Enigma
This section allows the admin to access Enigma, an advanced analytics platform that allows the provider to analyze sensor data and make informed decisions.
Overview / mobile app
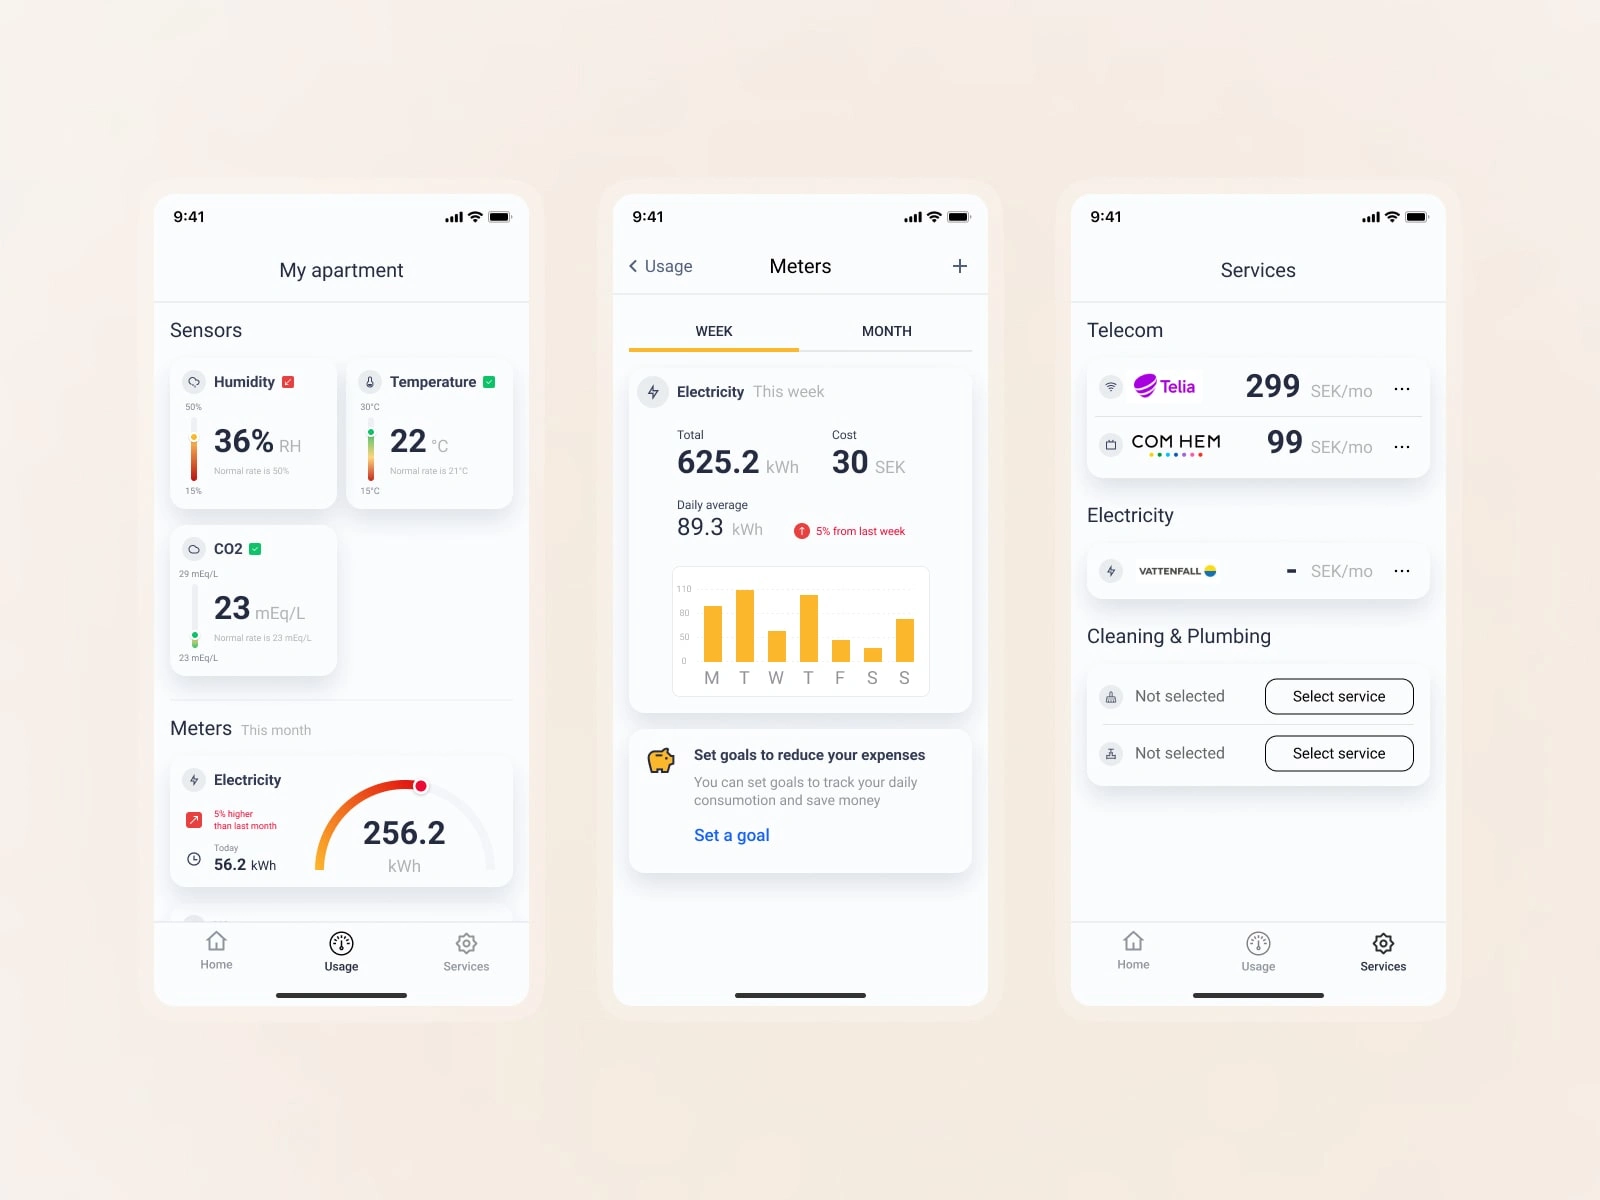
The mobile app is designed to provide customers with an easy-to-use and efficient solution for monitoring and controlling their IoT devices. The app includes the following main sections:
Homepage: The homepage of the mobile app includes the following features:
Usage: Allows customers to view and control the usage of the devices in the properties they have booked. This section includes the following features:
The services page includes the following sections:
Styleguide
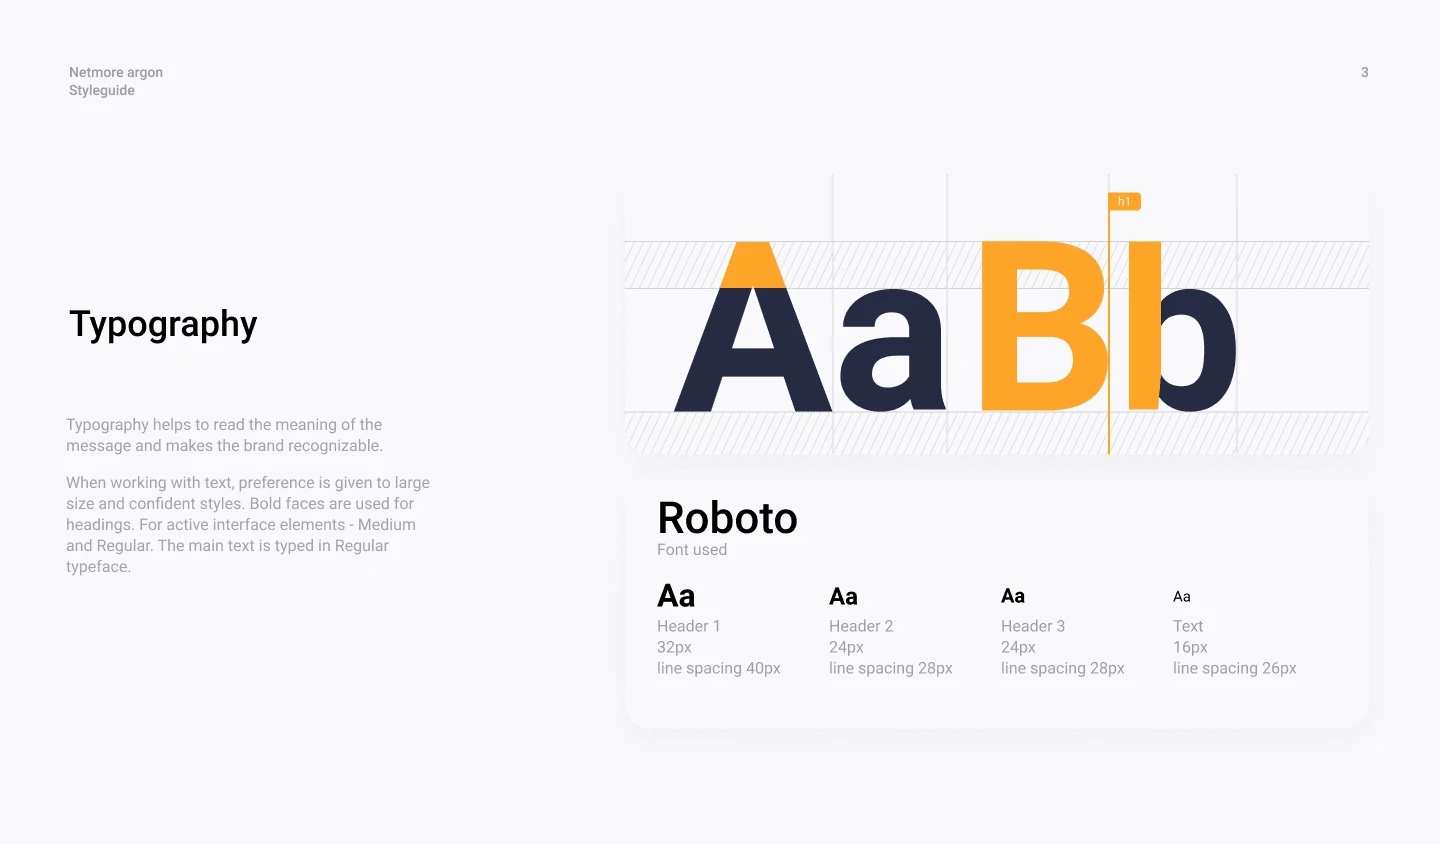
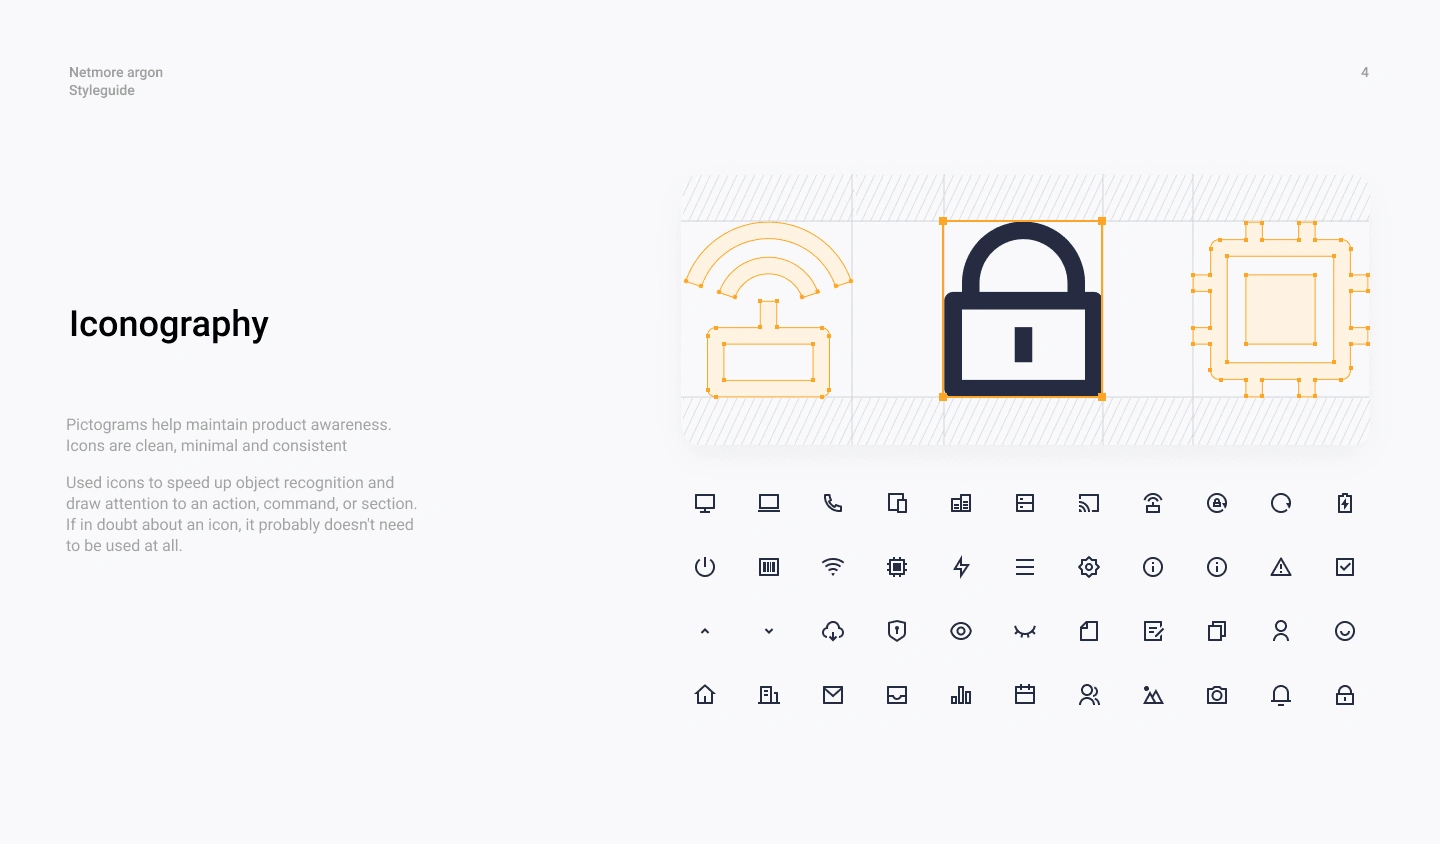
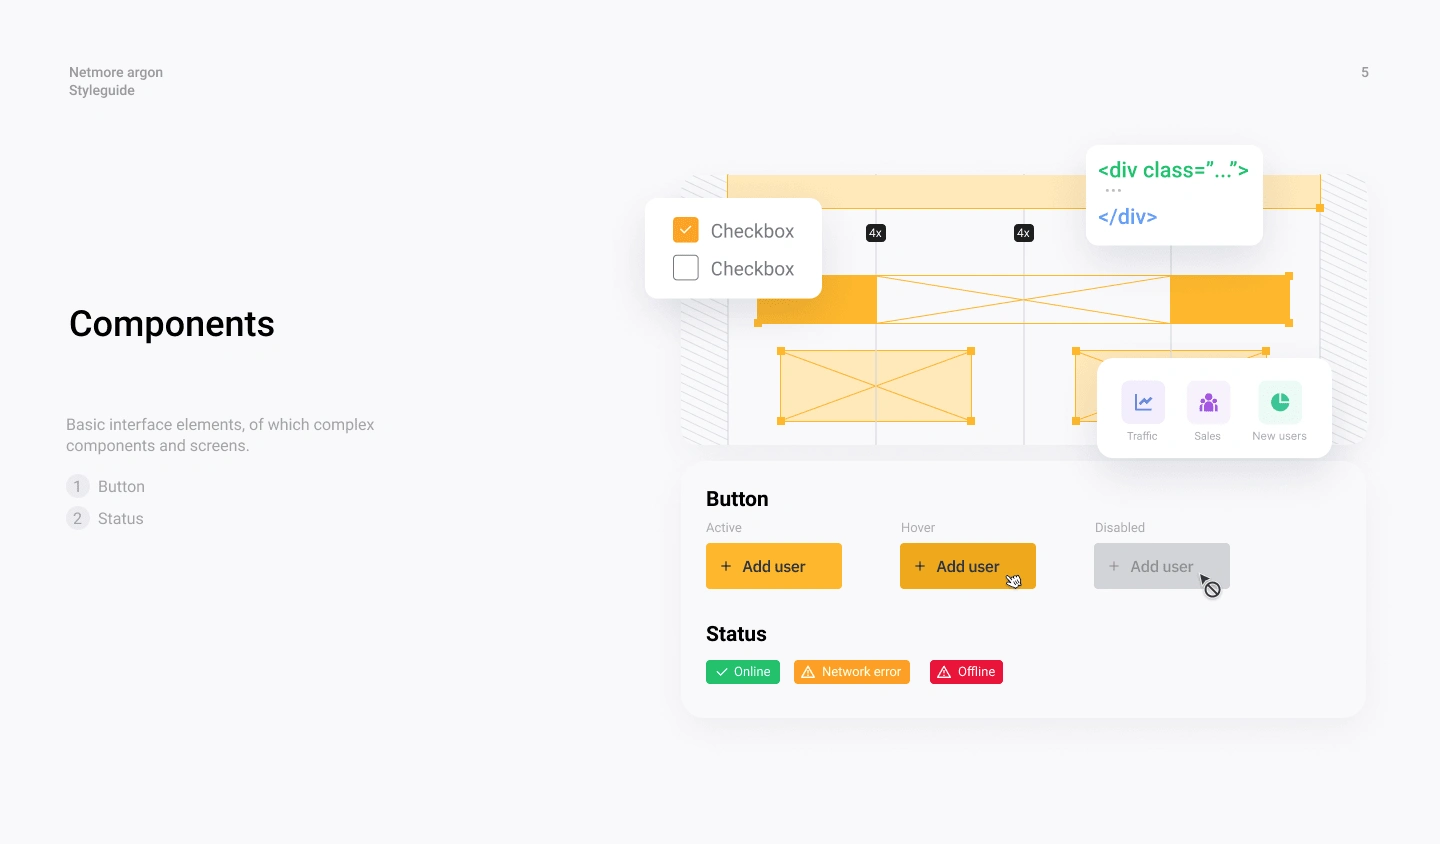
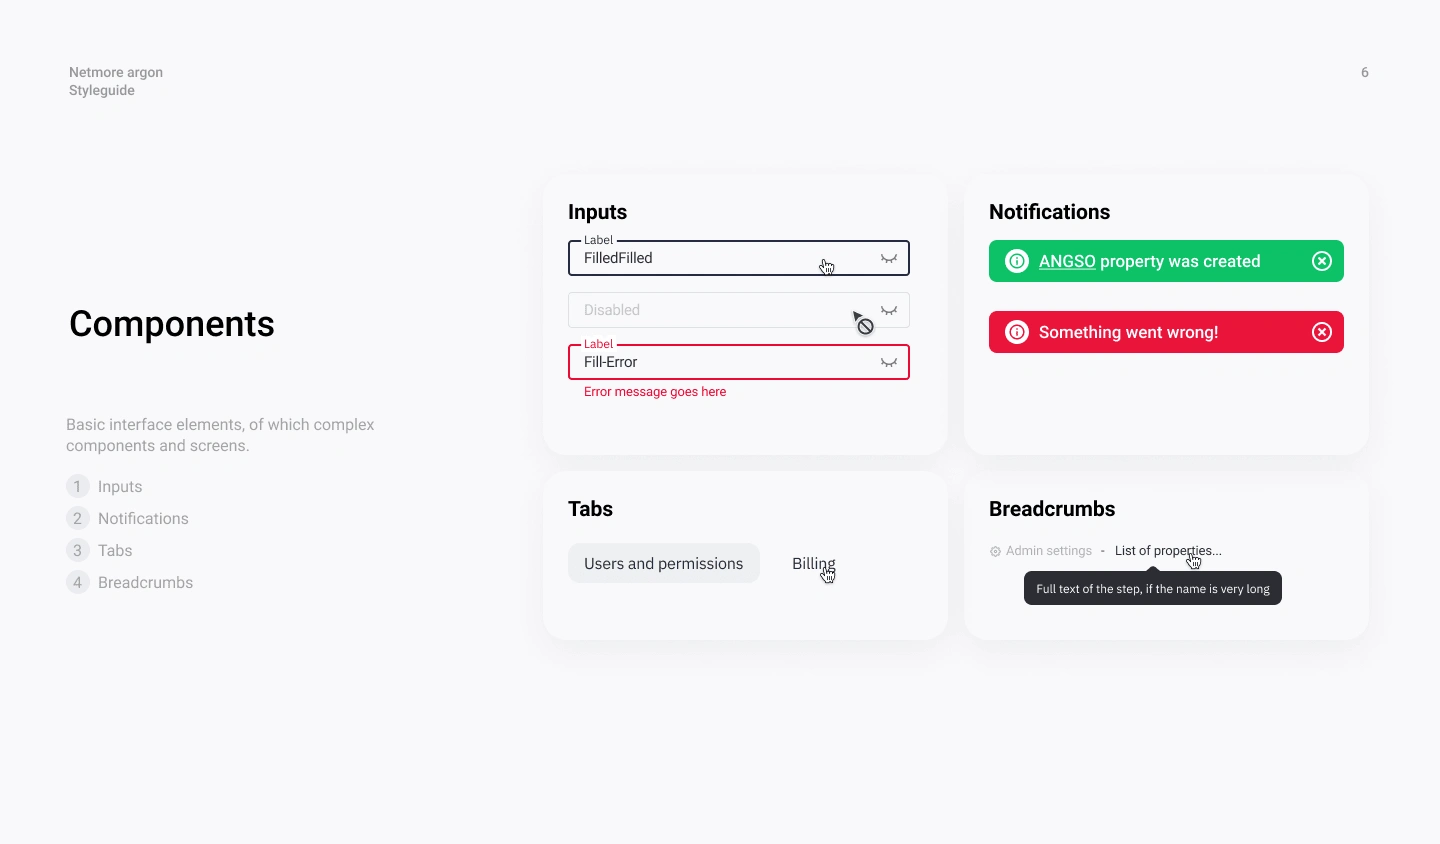
By understanding the key takeaways from the UI design, companies and developers can learn how to create a consistent, clean, simple, responsive and user-centered design for their IoT devices and sensors management and tracking systems, providing an efficient and easy-to-use solution for their customers.
The visual style of the admin panel and mobile app is designed to be entertaining and flexible. The design team aimed to create a visual style that is engaging and visually pleasing for the users, while still being easy to use and efficient.
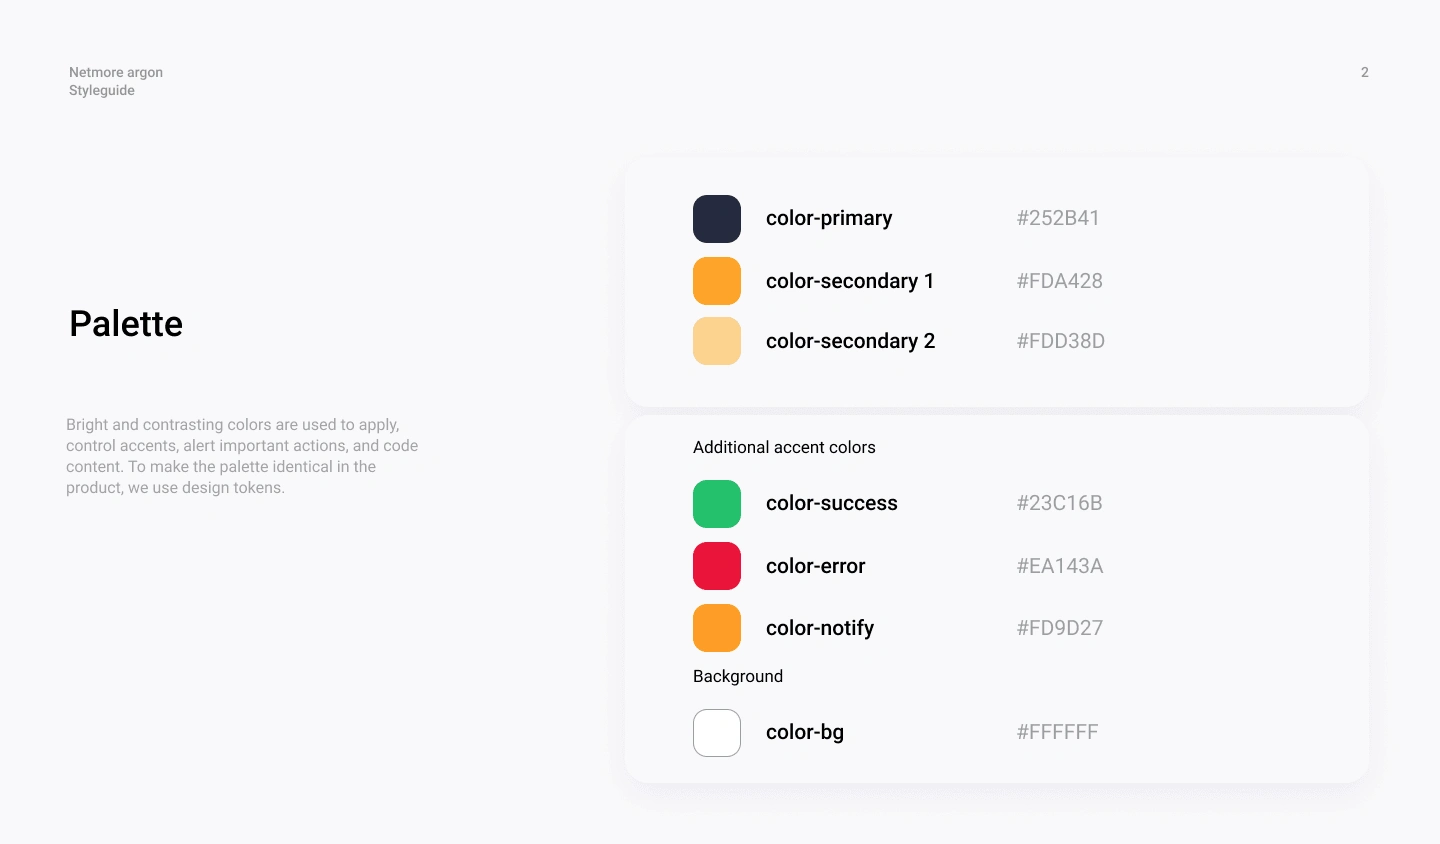
Entertaining: visually engaging and pleasing to the eye, using bright and contrasting colors, and incorporating elements such as icons and illustrations to make the interface more interesting and appealing. This helps to keep the users engaged and motivated to use the solution.
Flexible: allowing users to easily adjust the layout and display of information based on their specific needs. The layout is clean and simple, with a clear hierarchy of information, making it easy for the users to find what they are looking for. This allows the users to customize their experience and make it more personalized to their needs.
Like this project
Posted Oct 30, 2023
Creation of design system and working on design for admin panel and sensor tracking mobile app.
Likes
0
Views
7


