Built with Jitter
Real Time Cyber Threat Visualization Design
Rotem Pinkas
Designing a Real Time Cyber Threat Visualization Platform
My Role - Lead Product Designer
UX/UI design for a live cyber intelligence platform focused on real time threat visibility, rapid decision making, and enterprise scale monitoring.
ֿThe Challenge
Security analysts monitor thousands of cyber threats simultaneously. Existing systems were overloaded with complex data, making it difficult to identify critical attacks in real time.
Outcome
Designed a scalable cyber monitoring experience that transformed complex attack data into a clear, actionable real time visualization system.
Designing a real time cyber threat monitoring platform focused on data visualization, rapid decision making, and enterprise UX.
Problem
Security teams struggled to quickly identify critical threats inside dense data environments.
Solution
I redesigned the monitoring experience into a visual first cyber intelligence map with prioritized alerts and simplified threat flows.
Impact
Faster threat recognition
Reduced visual overload
Improved situational awareness
Enterprise ready scalable UI system
Usability Testing Summary – Attack Map
Usability testing was conducted with 3 users actively investigating incidents through the attack map. Overall, participants quickly understood the general structure of the map and found the layout clear and easy to navigate.
However, the testing revealed several usability gaps during the investigation flow. Users struggled to understand the chronological progression of the attack and found the relationships between connected entities unclear. Existing navigation paths to affected assets and related insights were often overlooked, reducing investigation efficiency.
Participants also felt that grouping behavior introduced unnecessary complexity in smaller attack maps where fewer entities were displayed. In addition, users expected faster investigation workflows, including the ability to pivot directly into Threat Hunting, Threat Intelligence, or add entities to IOC lists.
Visual clarity was another recurring challenge. Users had difficulty distinguishing between indicator severity and insight severity, while filter counters and remediation indications were often missed. Participants also expected clearer visual feedback for isolated assets and actions already taken during the investigation process.
These findings helped refine the visual hierarchy, navigation patterns, grouping behavior, and investigation workflows to create a clearer and more scalable attack investigation experience.
Key Fixes Implemented Based on Usability Feedback
Overall Understanding
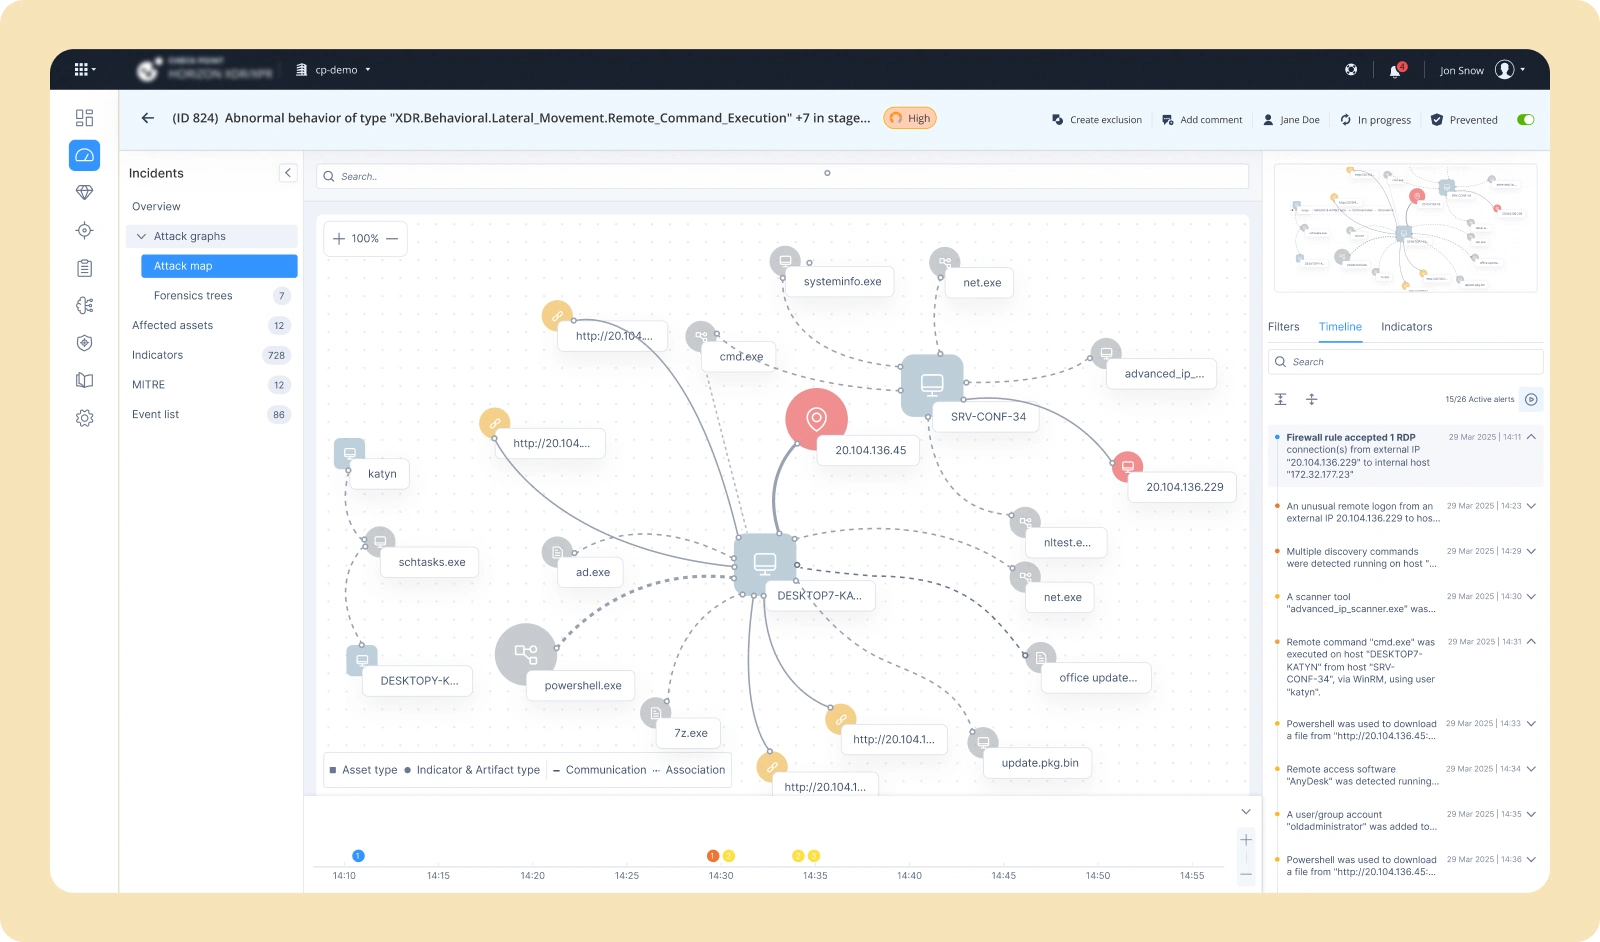
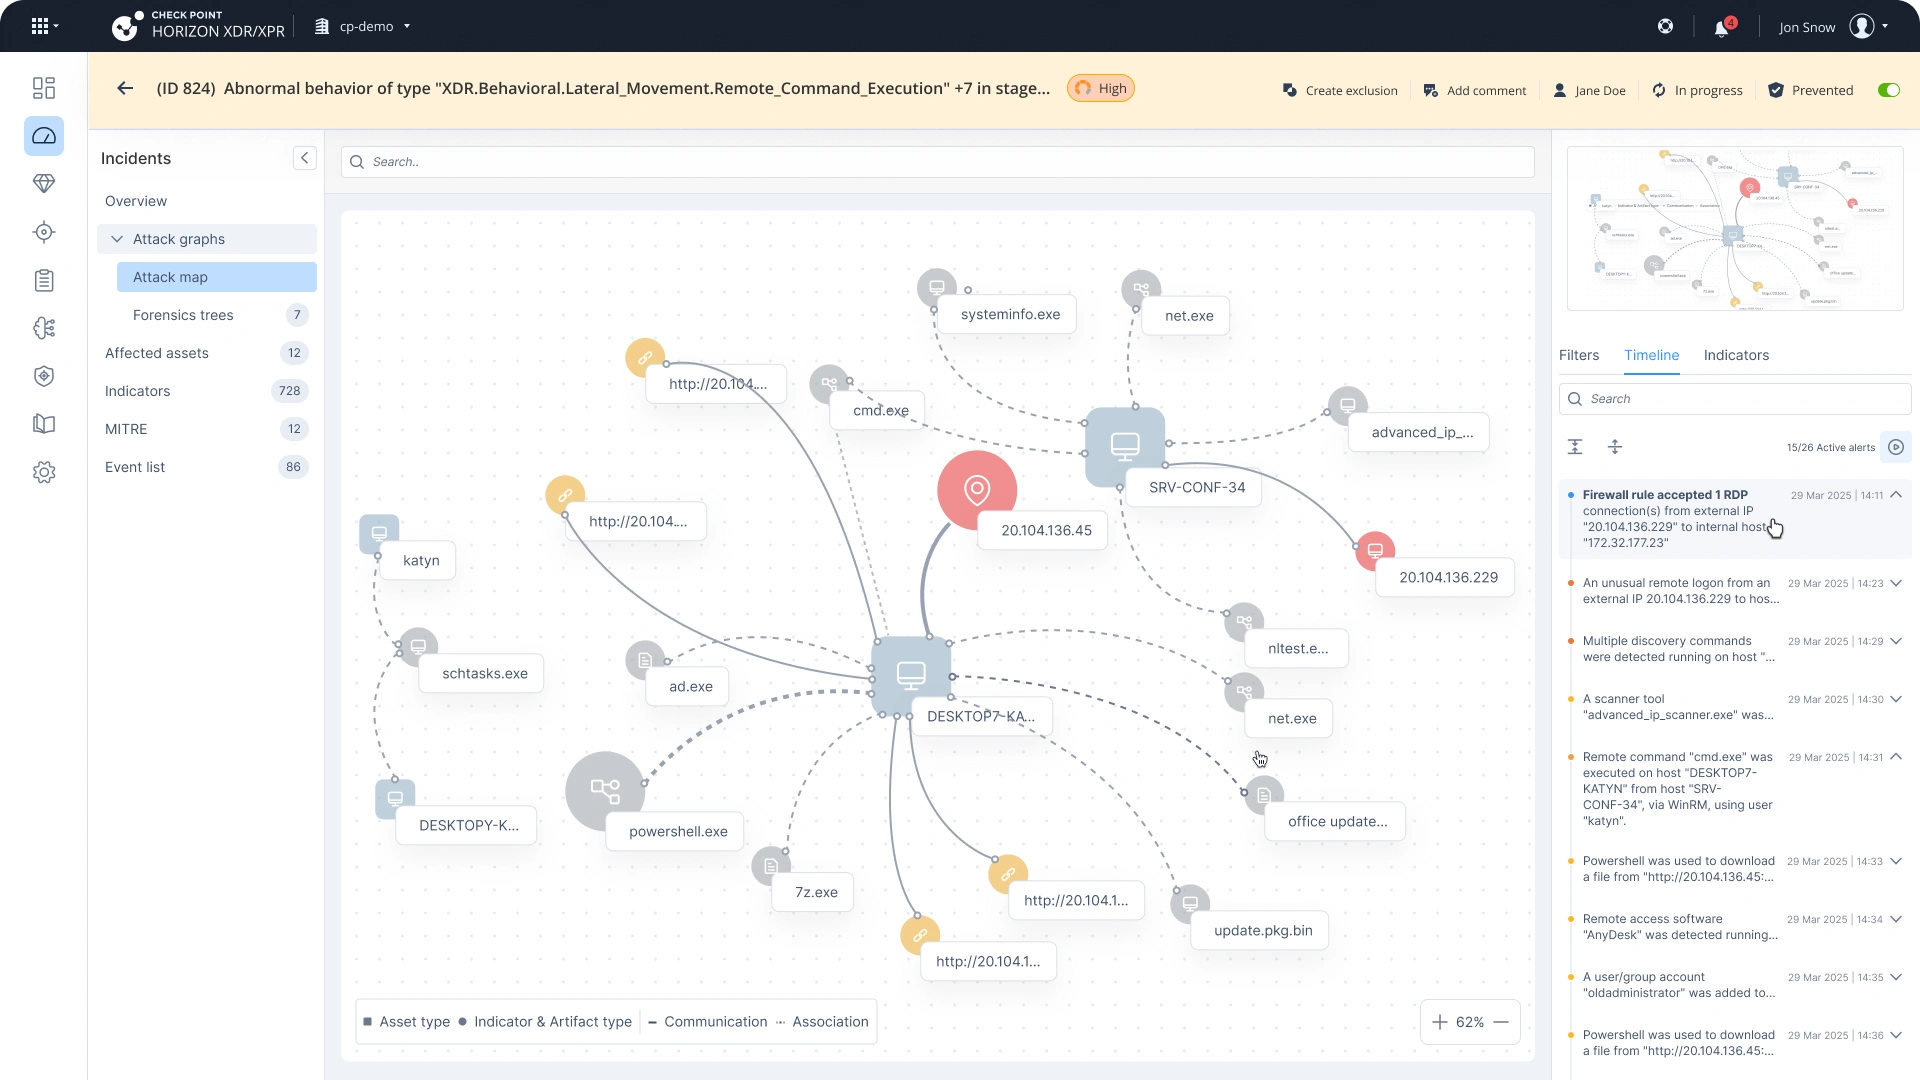
To improve the understanding of the attack progression, a timeline chart and event list were added to present the chronological flow of the attack more clearly.
The connection logic between entities was also redesigned by introducing two distinct connection types: communication and association. Communication represents interactions between assets such as devices and users, while association represents relationships between assets and indicators like files, URLs, or processes.
Grouping
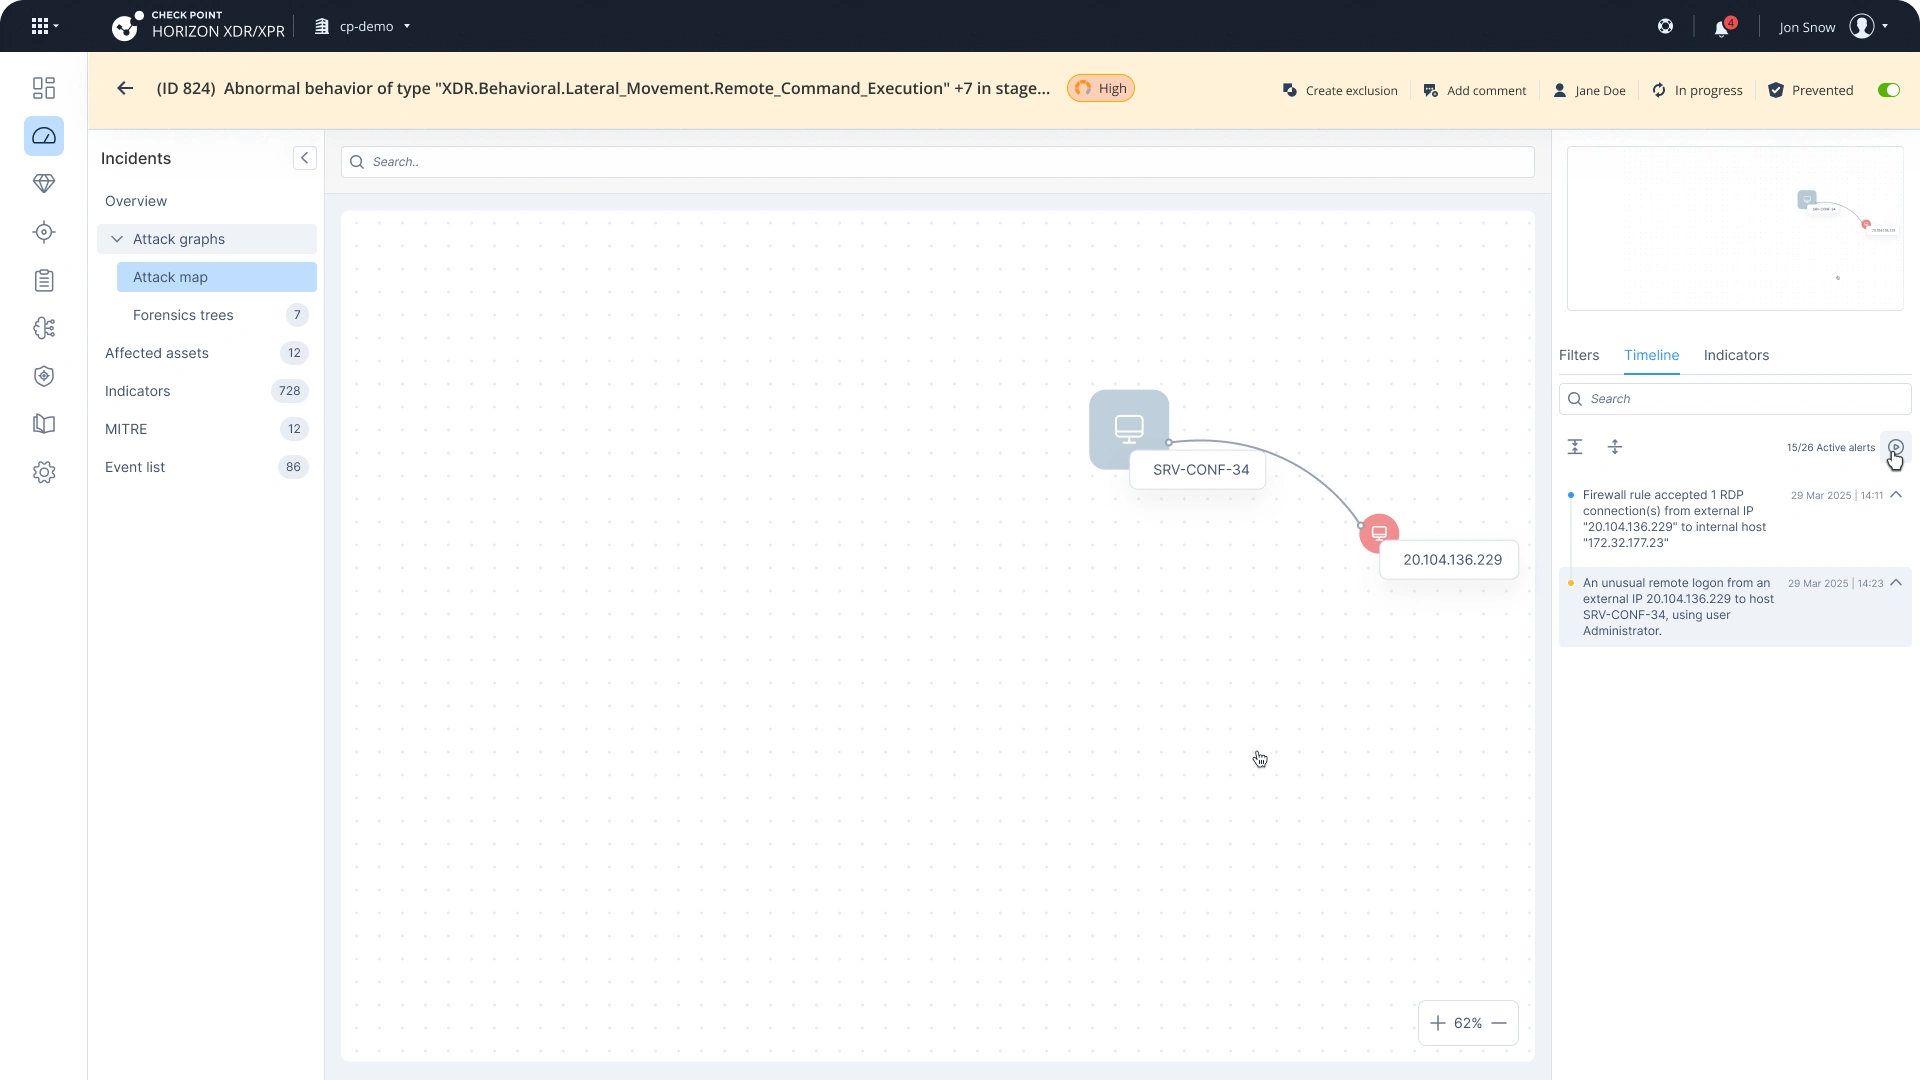
Default grouping behavior was removed, since most attack maps were relatively small and did not require additional grouping layers. This reduced unnecessary interactions and simplified the investigation flow.
Investigation
New pivot actions were added directly into entity tooltips, allowing users to quickly navigate to Threat Hunting, Threat Intelligence, or add entities to IOC lists.
Additional tooltip indications were introduced to provide clearer information about attack-related actions, including whether an asset had already been isolated during remediation.
Filters & Visual Cues
Filter counters were removed from section titles and displayed only within the filter area to reduce visual noise and improve clarity.
To better communicate severity information, the interface now displays the number of related insights and provides detailed severity information within the tooltip experience.
Tags: Product Design, Senior Product Designer, UX Design, UI Design, UX Research, Dashboard Design, SaaS Design, Cybersecurity,
Looking for a senior product designer for complex SaaS or cybersecurity platforms?
Let’s build scalable experiences users can understand instantly.
Like this project
Posted May 18, 2026
Redesigned a complex cyber attack investigation map to help security analysts understand attack flow, entity relationships, and incident timelines in real time.