Sales Analytics Dashboard (Power BI) Interactive
Nikhil Mishra
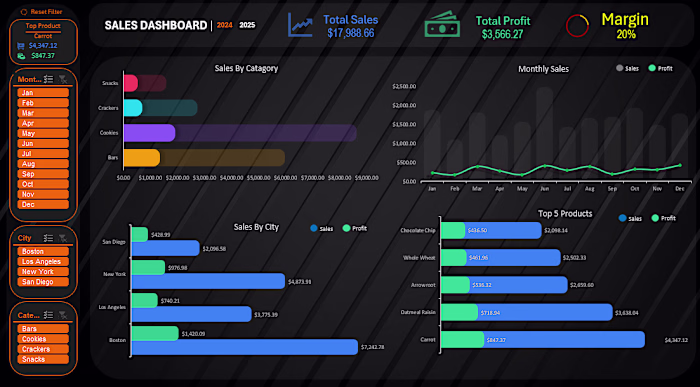
Sales Analytics Dashboard (Power BI)
Interactive sales analytics dashboard built in Microsoft Power BI to monitor revenue performance, profitability, and product trends.
Key insights included:
• Total revenue, profit, cost, and margin KPI tracking
• Monthly sales performance and trend analysis
• Best-selling products and most profitable categories
• Sales performance by city
• Interactive filtering by product, category, and location
This dashboard enables businesses to quickly identify top products, evaluate profitability, and monitor sales trends across regions.
Tools used: Microsoft Power BI, data modeling, and data visualization.
Like this project
Posted Mar 15, 2026
Sales Analytics Dashboard (Power BI) Interactive sales analytics dashboard built in Microsoft Power BI to monitor revenue performance, profitability, and pro...
Likes
0
Views
1