Service Performance & Cost Optimization
Nikhil Mishra
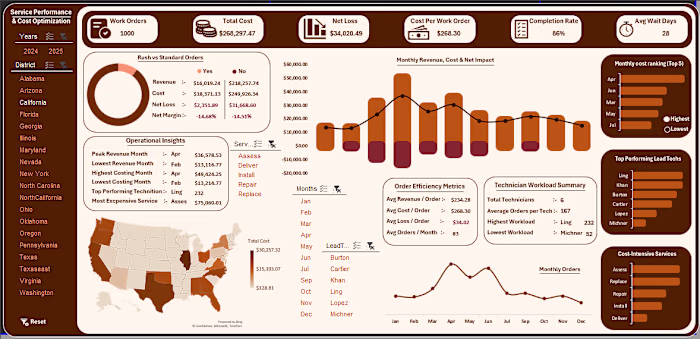
Service Performance & Cost Optimization Dashboard (Power BI)
Built an interactive dashboard in Microsoft Power BI to analyze service operations, costs, and performance trends.
Key insights included:
• Work order tracking and completion performance
• Total cost, net loss, and cost per work order analysis
• Monthly revenue vs cost trends
• Technician workload distribution
• Geographic performance visualization across districts
This dashboard helps businesses quickly identify operational inefficiencies, cost drivers, and performance patterns to support better decision-making.
Tools used: Microsoft Power BI, data modeling, and data visualization techniques.
Like this project
Posted Mar 15, 2026
Service Performance & Cost Optimization Dashboard (Power BI) Built an interactive dashboard in Microsoft Power BI to analyze service operations, costs, and p...
Likes
0
Views
1