Transform Raw Data into Insights with Power BI Dashboards
Nikhil Mishra
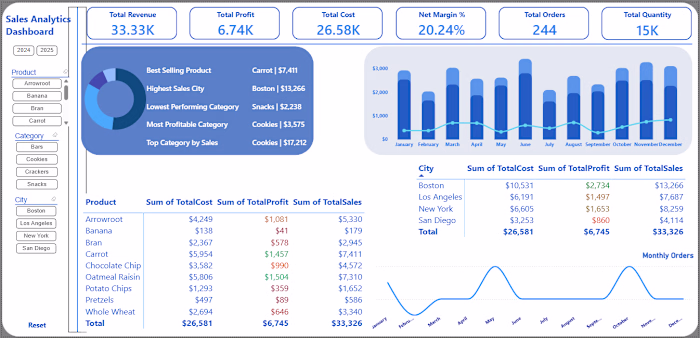
Built this Service Performance Dashboard in Power BI ⚡
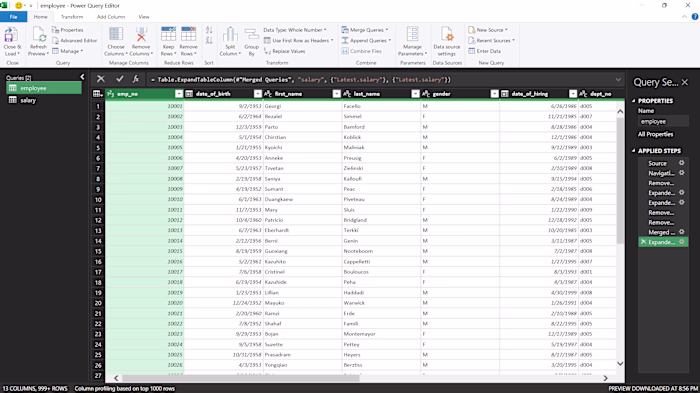
Transformed raw data into actionable insights on:
• Revenue & profit trends
• Cost optimization opportunities
• Technician performance
• Regional performance analysis
Used interactive visuals, filters, and KPIs to make decision-making faster and clearer.
Key takeaway? A dashboard isn’t about visuals—it’s about driving decisions.
More projects dropping soon 🚀
Like this project
Posted Apr 1, 2026
Built this Service Performance Dashboard in Power BI ⚡ Transformed raw data into actionable insights on: • Revenue & profit trends • Cost optimization oppo...
Likes
0
Views
0