Sales Performance Dashboard (Excel) Interactive Excel
Nikhil Mishra
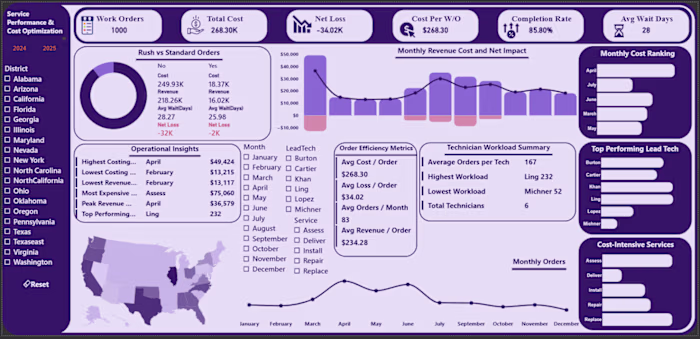
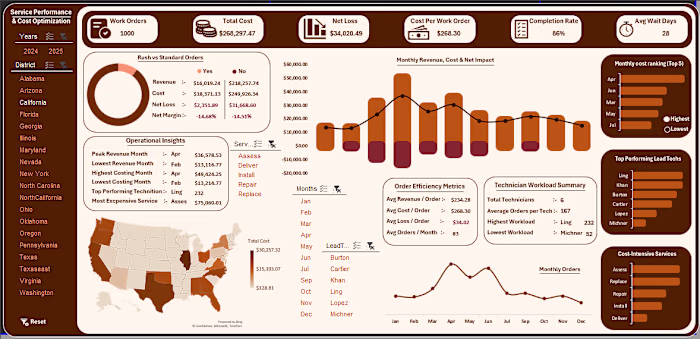
Sales Performance Dashboard (Excel)
Interactive Excel dashboard built to analyze sales performance, product profitability, and regional trends.
Key features:
• Total sales, total profit, and margin KPI tracking
• Monthly sales and profit trend analysis
• Sales performance by product category
• City-level sales comparison
• Top performing products analysis
• Interactive filtering by month, city, and category
This dashboard helps businesses quickly understand revenue performance, identify profitable products, and monitor sales trends.
Tools used: Microsoft Excel, pivot tables, and data visualization.
Like this project
Posted Mar 15, 2026
Sales Performance Dashboard (Excel) Interactive Excel dashboard built to analyze sales performance, product profitability, and regional trends. Key features:...
Likes
0
Views
1