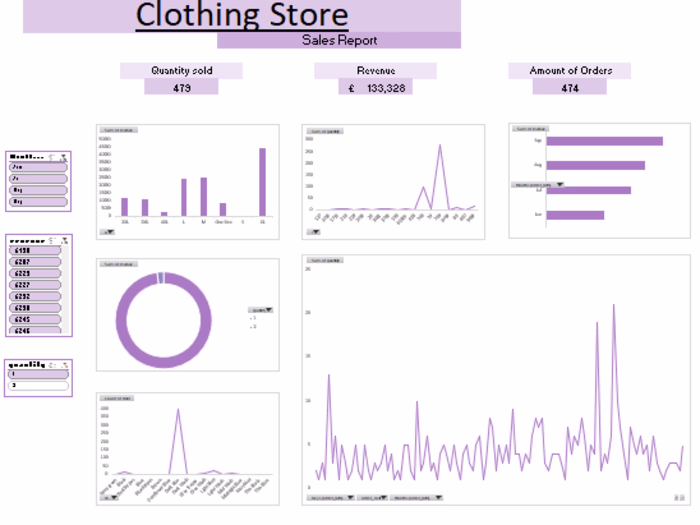
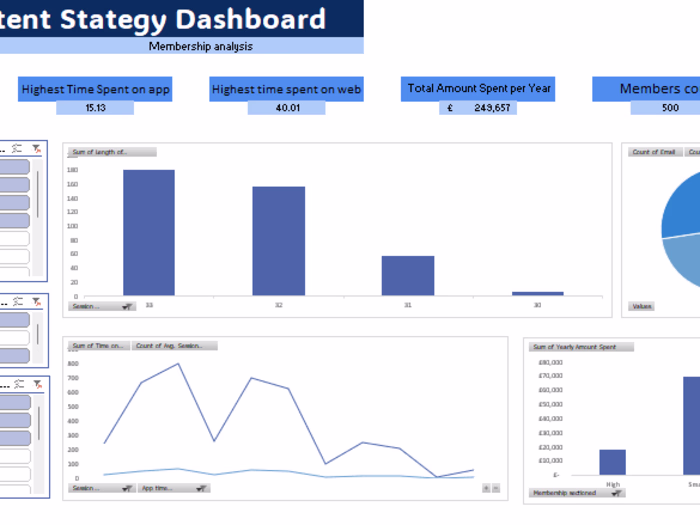
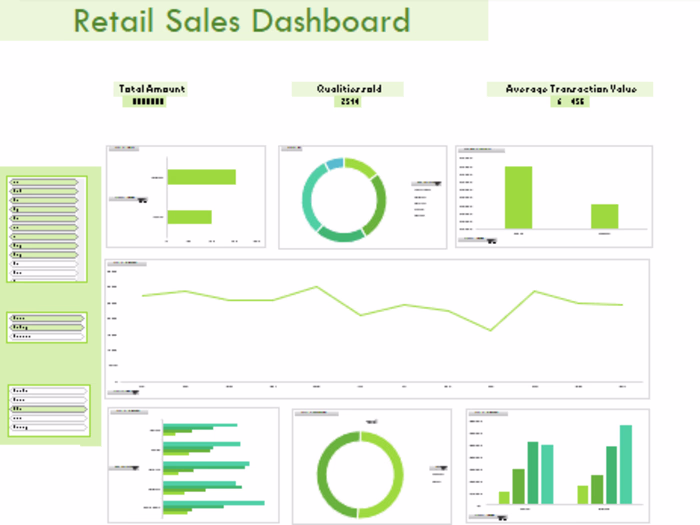
Amazon FBA Sales Dashboard
Bright Mike
Tracked the following
Sales Performance: Track total sales revenue, average order value, and sales by category.
Order Analysis: Monitor total orders, trends over time, and identify top-selling products.
Discount and Pricing: Analyze average discount percentage and price variance between TP and MRP.
Geographic Distribution: Visualize sales by state using heat maps and order volume distribution.
Cost Analysis: Calculate total costs and profit margins.
Payment Insights: Assess payment portal usage and discrepancies between expected and actual payments.
This dashboard focuses on user-centric layout, interactivity, regular updates, and contextual insights.
Like this project
Posted Sep 24, 2024
Tracks Sales Performance, analyses Orders by location and quantity, and provides insight into cost and Payments. It has a user-centric layout & interactivity
Likes
0
Views
17