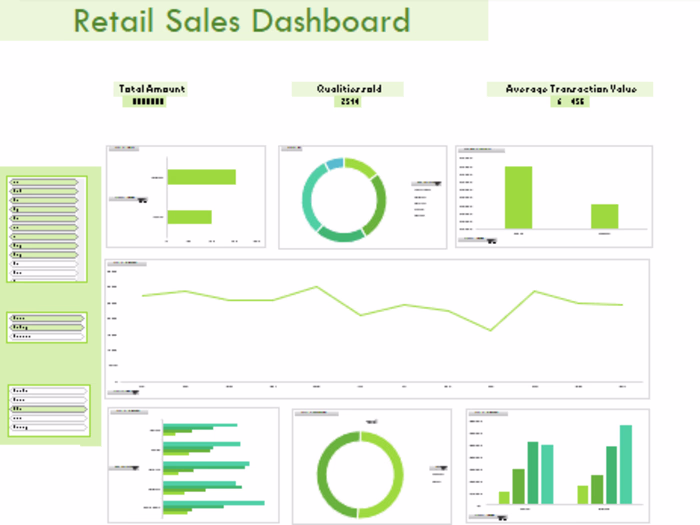
Content Stategy Dashboard
Bright Mike
For this dashboard, the key metrics were:
Avg. Session Length: Indicates user engagement.
Time on App: Highlights app effectiveness.
Time on Website: Compares user preferences.
Length of Membership: Reflects loyalty and retention.
Yearly Amount Spent: Shows user value.
The visualization Ideas:
Line charts for trends.
Bar graphs for spending comparisons.
Pie charts for membership distribution.
Like this project
Posted Sep 24, 2024
Analyses the user engagement, highlights app effectiveness, compares user preferences, and measures the length of Membership & Amount Spent
Likes
0
Views
10