Retail Sales Analysis
Bright Mike
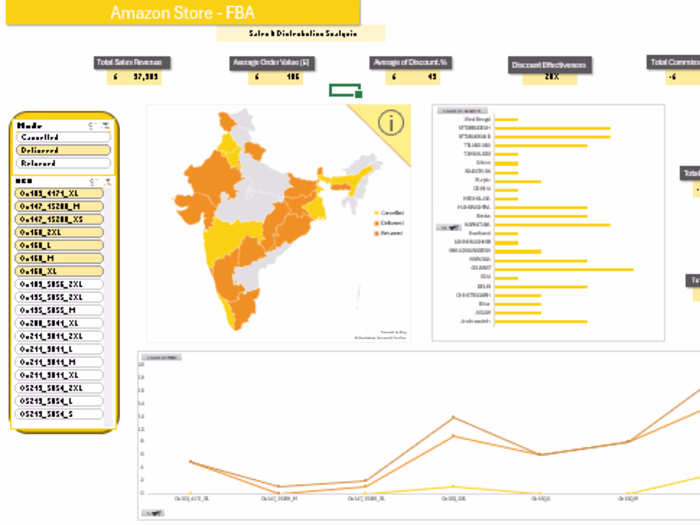
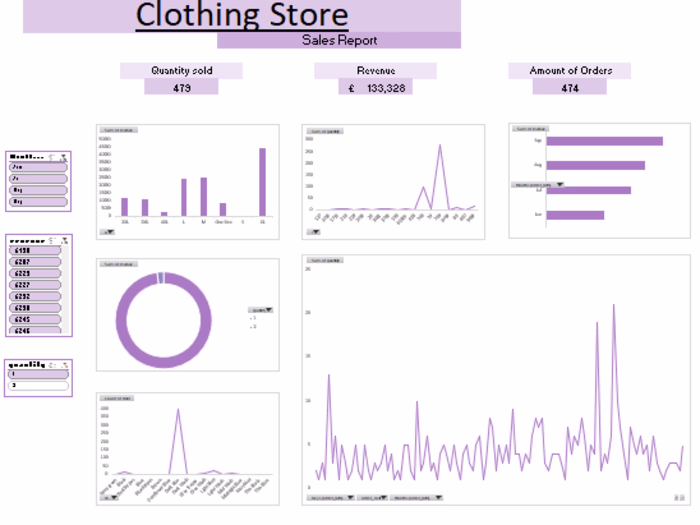
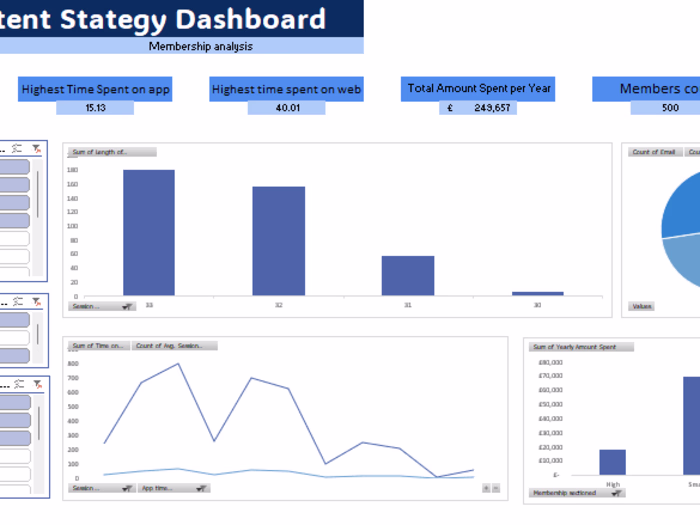
Using retail sales data, you can create insightful dashboards to drive business decisions:
Sales Overview: Track total sales, trends, and top products
Customer Insights: Analyze segmentation, and repeat business
Product Performance: Visualize sales by category, pricing, and inventory
Promotional Effectiveness: Measure sales impact during promotions
Operational Metrics: Calculate average transaction value
Financial Performance: Assess revenue & costs
These dashboards leverage data visualization to provide actionable insights for enhancing retail performance and customer satisfaction.
Like this project
Posted Sep 24, 2024
These dashboards provide insights for enhancing retail performance and customer satisfaction. Track sales by category, pricing, and inventory.
Likes
0
Views
13