BRX AI: Product Strategy & Onboarding
Introduction
In the ever-evolving landscape of artificial intelligence, building effective AI technology demands robust and intuitive tools. BRX AI, a first-of-its’-kind developer platform, empowers developers to create new AI software with unprecedented efficiency. However, the complexities inherent in AI development necessitated the creation of tools that streamline workflows and enhance user onboarding. BRX is a seed stage company.
This case study explores two pivotal projects undertaken at BRX AI: creating the “Flow Tool” and building the first onboarding process. These initiatives underscore the importance of user-centered design and strategic collaboration in creating impactful AI development tools.
My Role
I was hired as a part-time CPO at BRX AI, leading product strategy and design for the team. I worked directly with the technical CEO and COO, as well as the lead engineer. My responsibilities included conducting competitive analysis, leading workshops, iterating on wireframes, creating high-fidelity mocks, and collaborating closely with stakeholders to ensure the successful implementation of these tools.
Flow Tool
As more users started using the BRX platform, we heard often that it was hard to understand how the “BRX” fit together. BRX represent individual AI operations, and can be chained together to create complex workflows. BRX are shareable, reusable, components that underpin the core value of the product. Our CEO had been using a cobbled together visualization tool behind the scenes that solved this pain point for him, but wasn’t generalizable to the whole product. Given the clear pain point, the team knew that a better solution needed to be found.
Competitive Analysis
To kickstart the flow tool project, I conducted a comprehensive competitive analysis to understand existing solutions and identify opportunities for innovation. This research provided valuable insights into the strengths and weaknesses of current tools, guiding our design approach. I talked to the internal team to understand how they had used these other tools, digging into the things they loved, and the pain points of each.
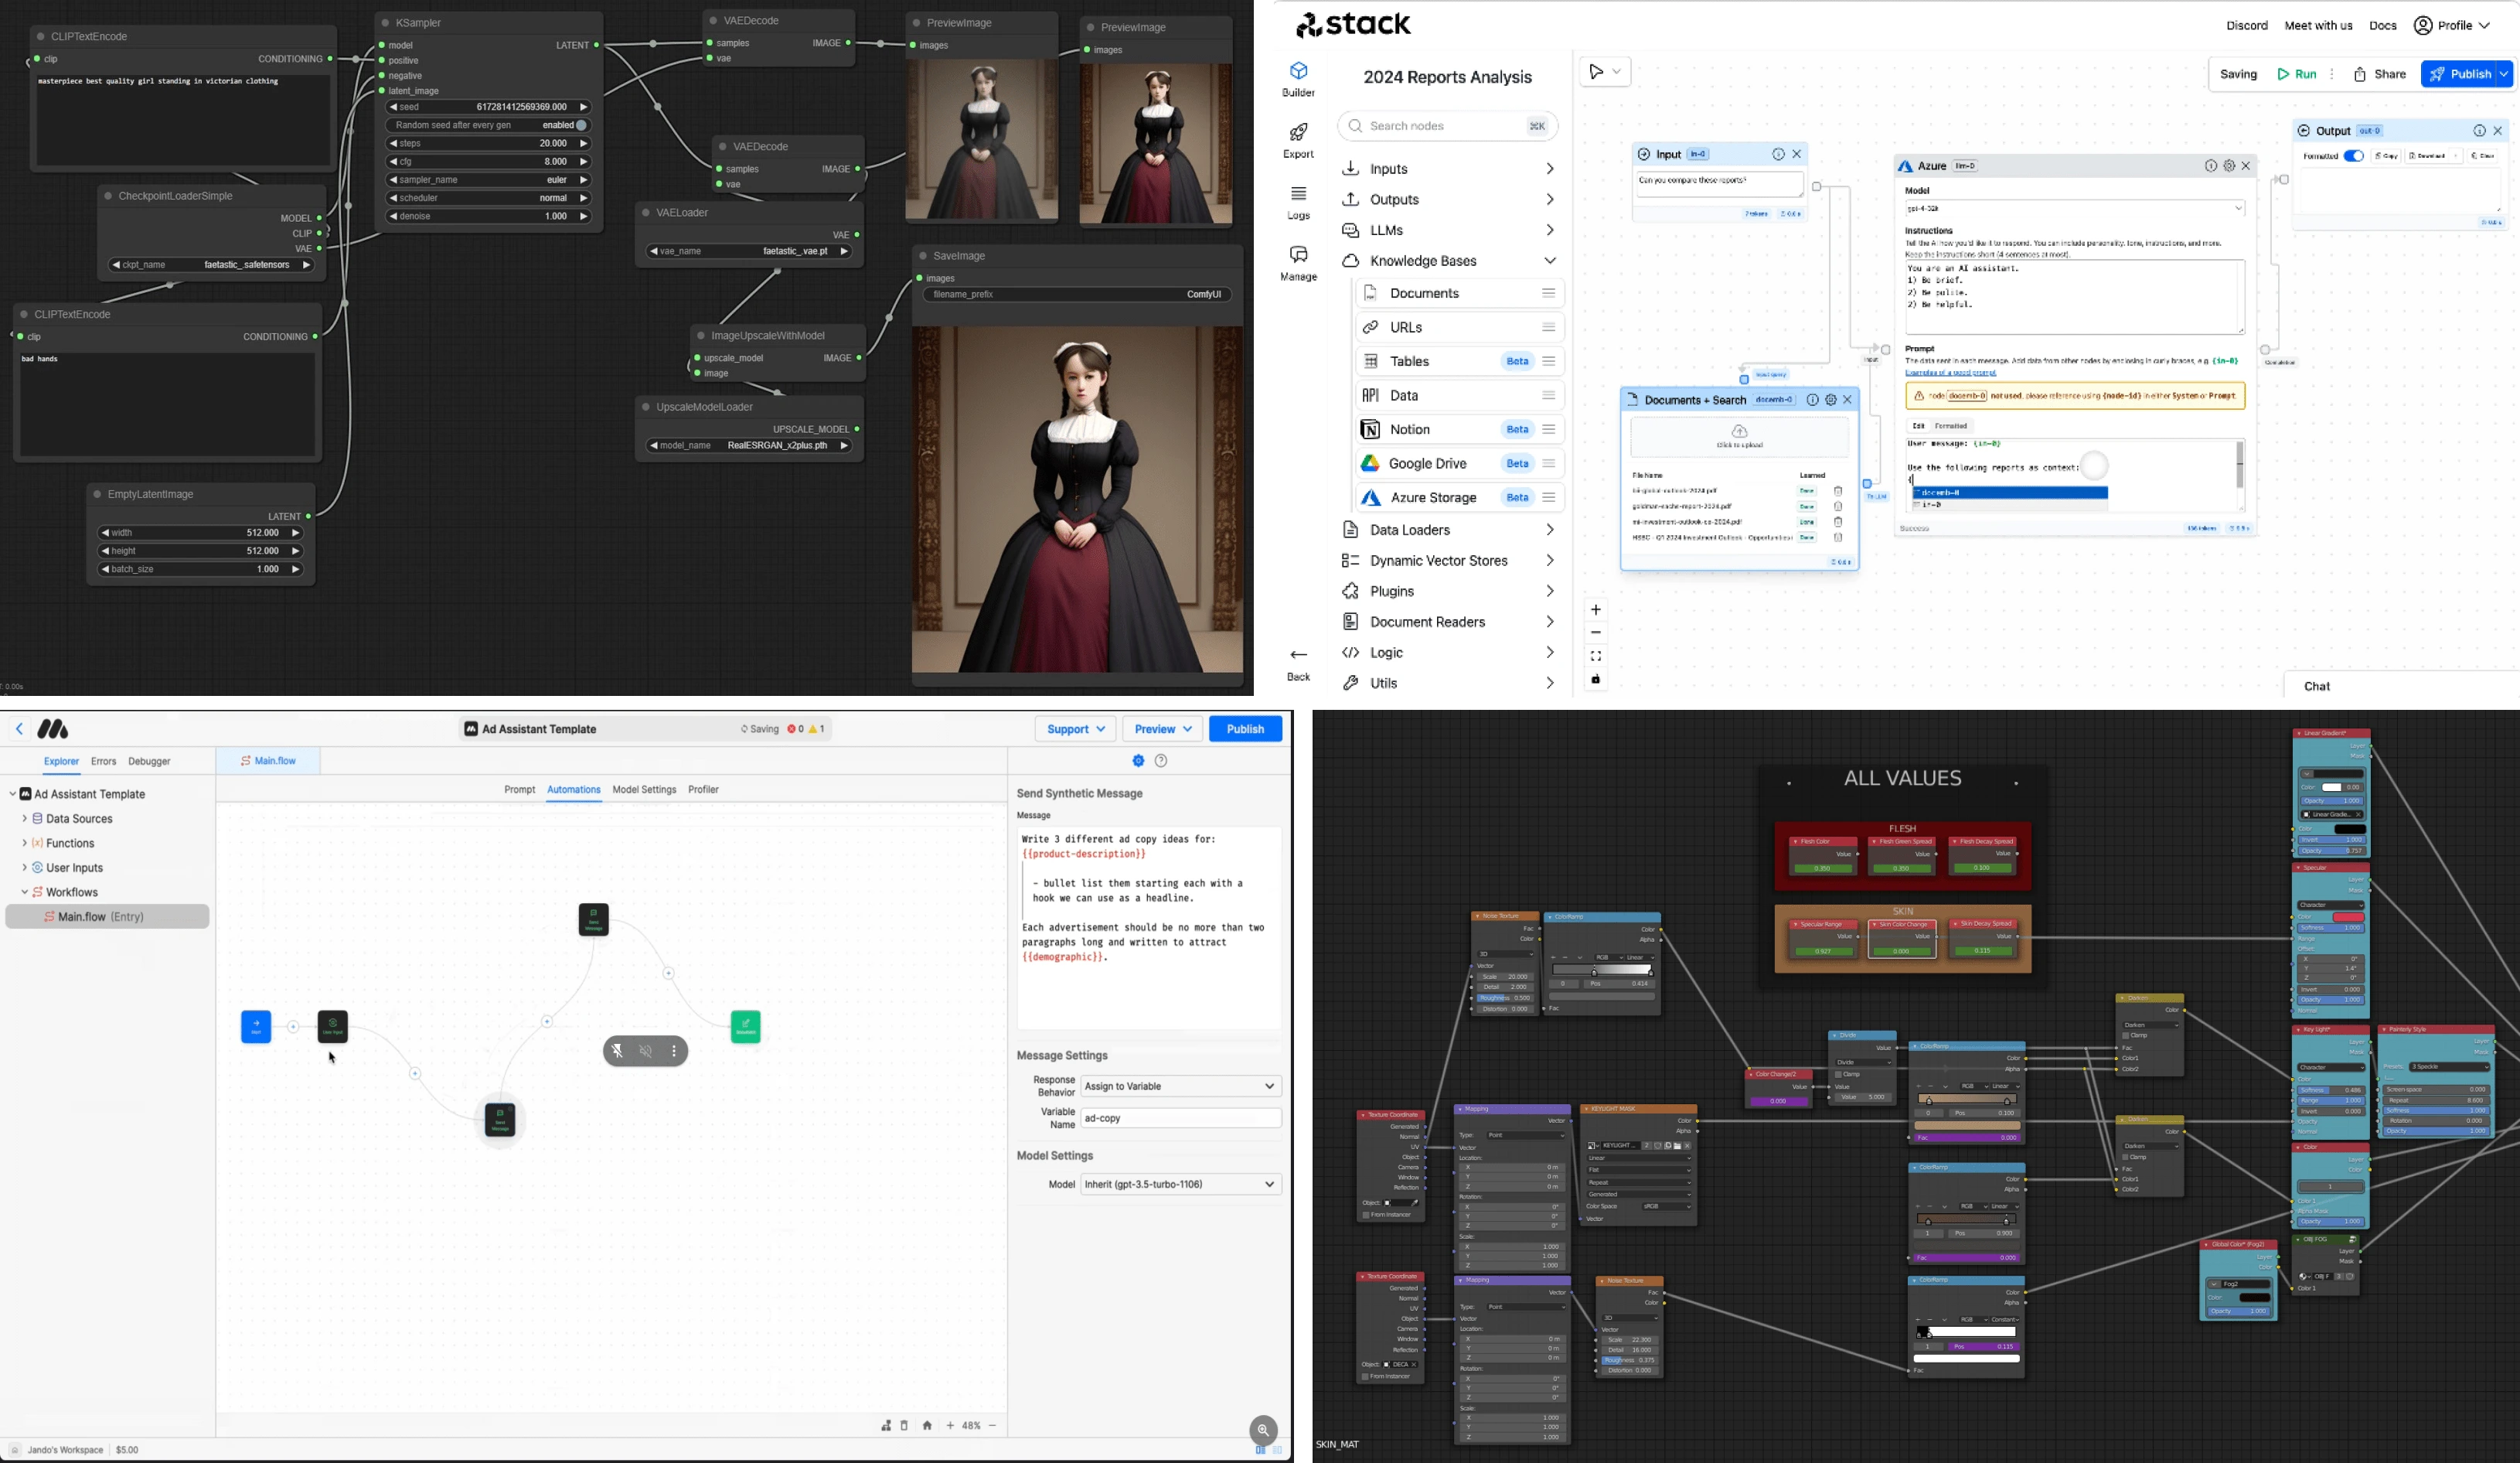
Visualization tools for developers across industries
Ideation & Iteration
I engaged in iterative wireframing sessions with the team, incorporating user feedback at each stage. This collaborative effort ensured that the final design addressed user needs effectively and intuitively. The final design featured a dynamic visualization tool that allowed developers to easily create, modify, and monitor their BRX chains.
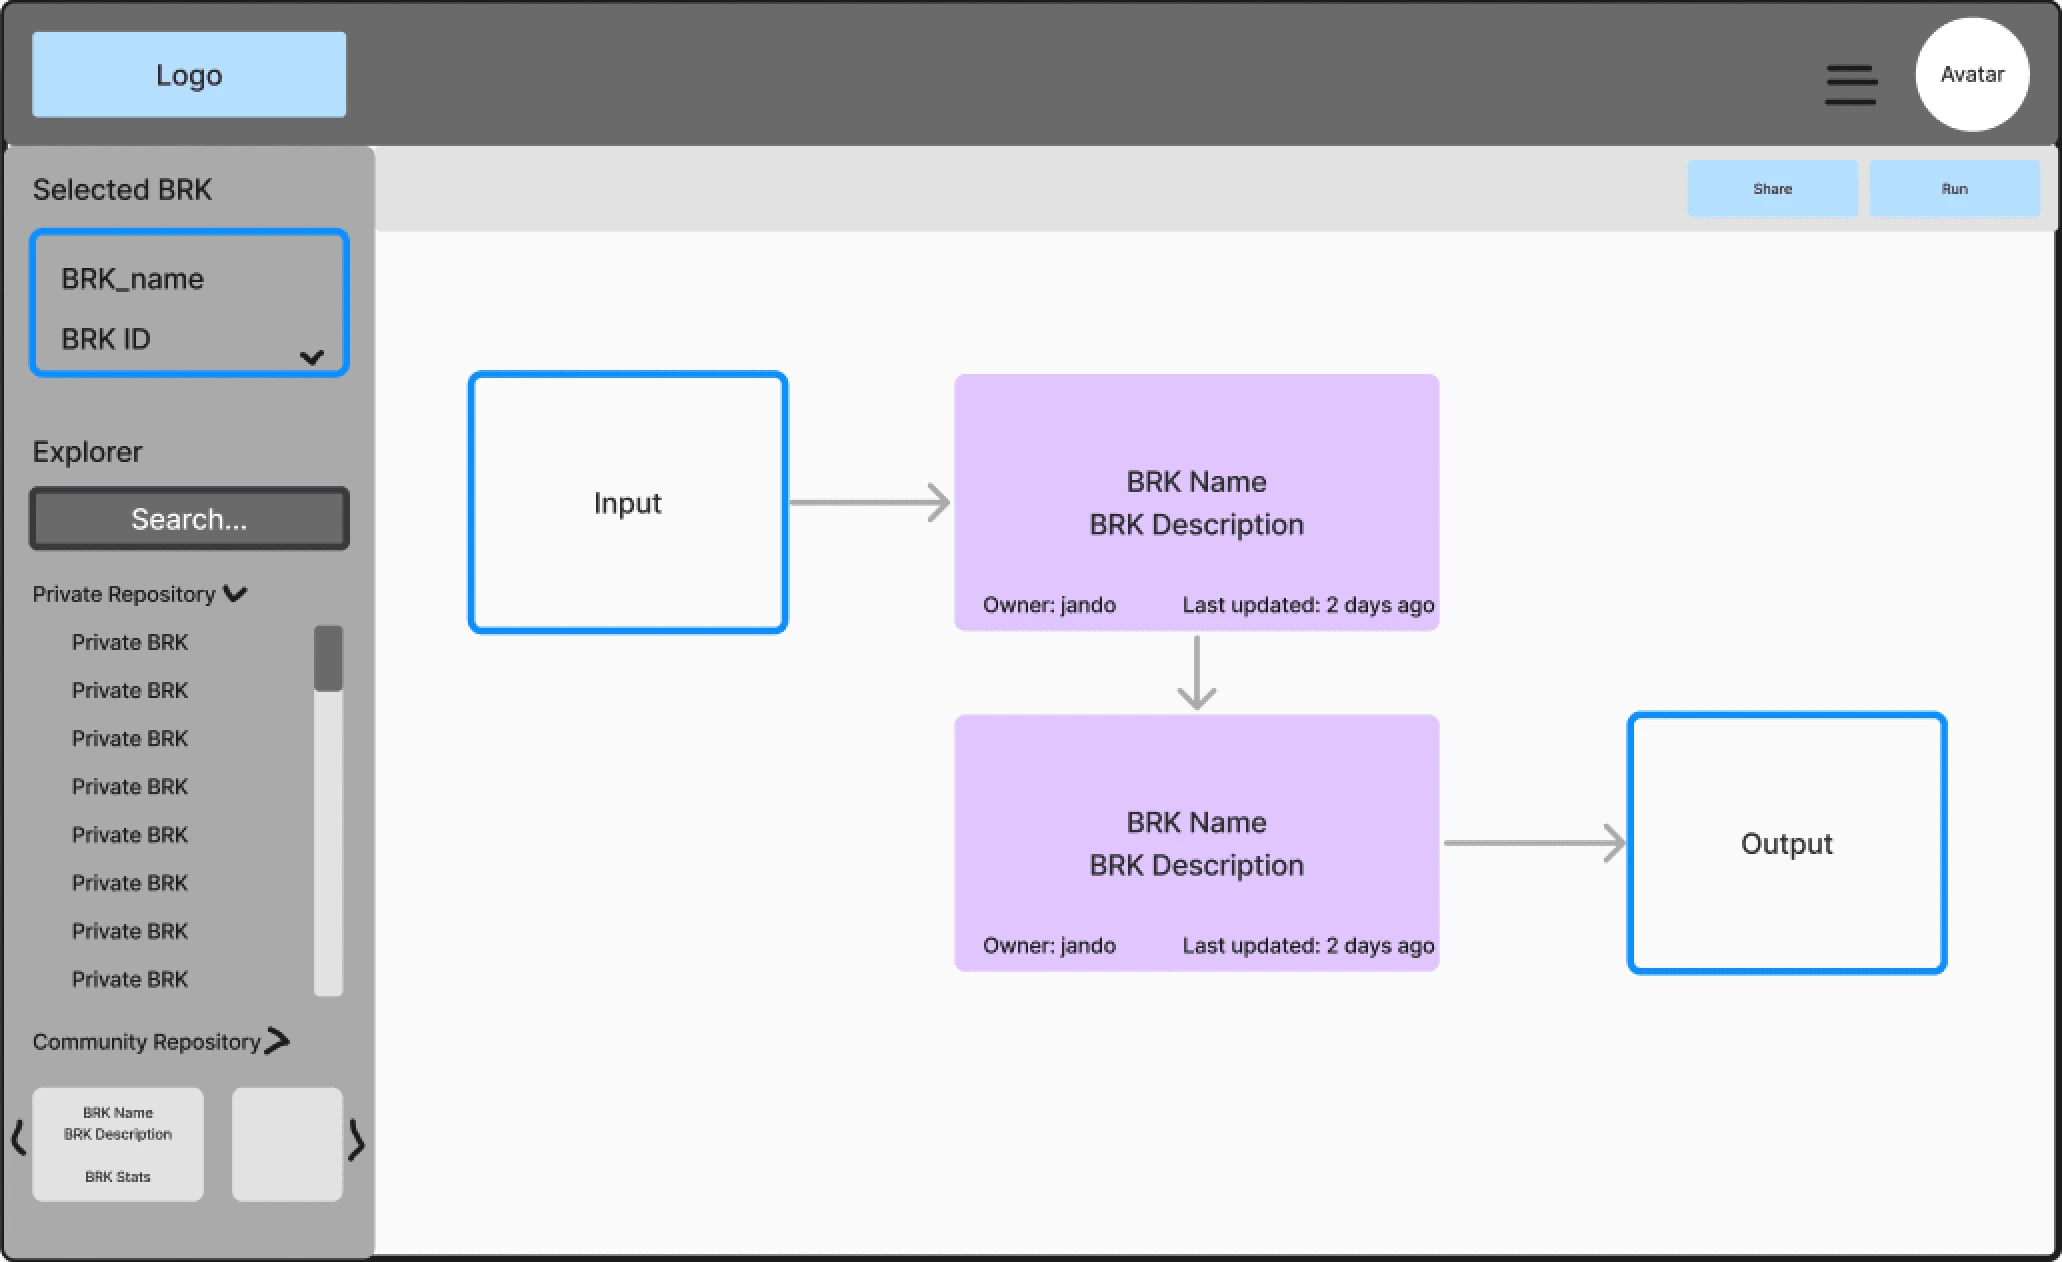
Version 1: Show how BRX chains are laid out, but only shows limited information about each operation. We heard that this wasn't actionable enough.
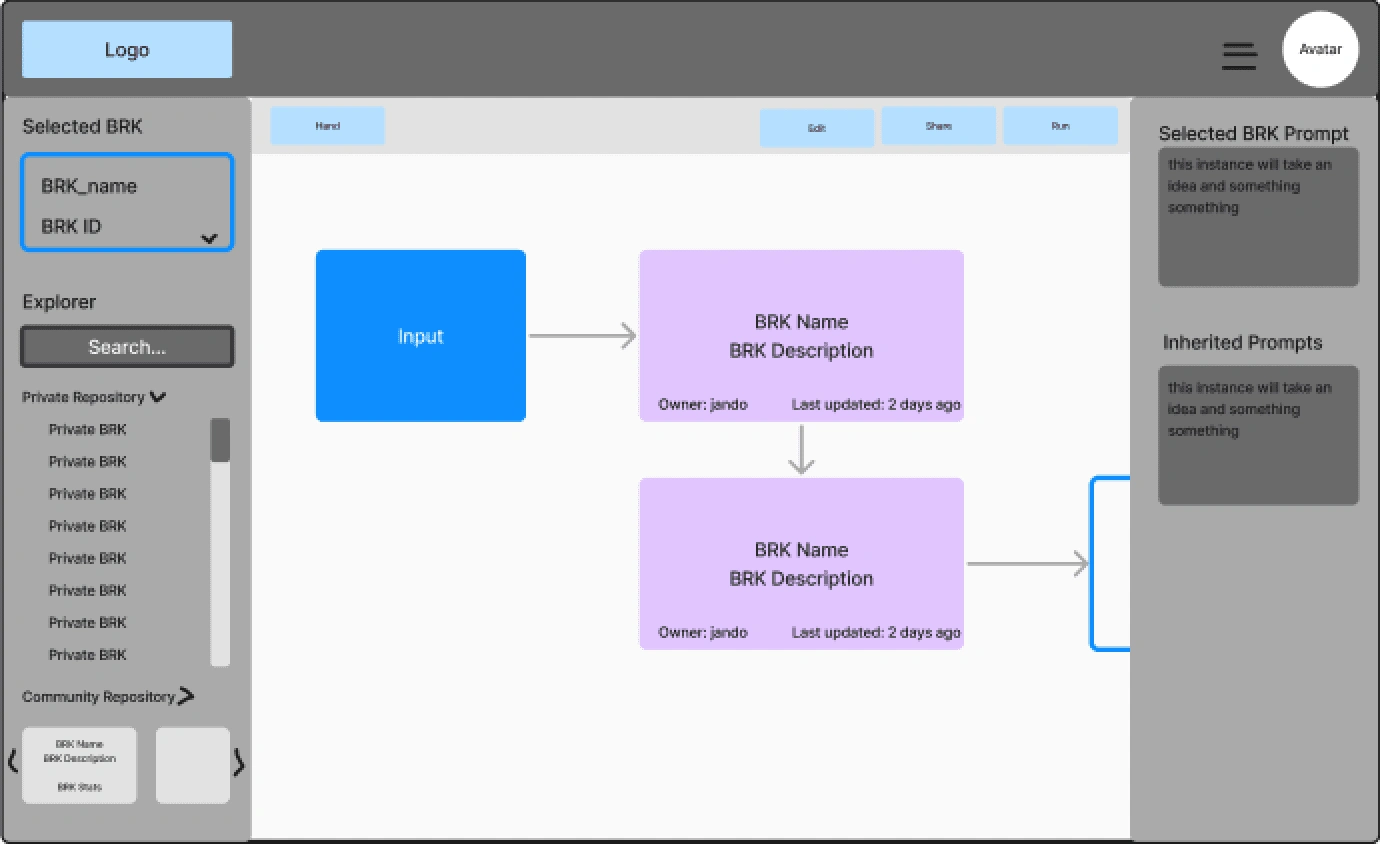
Version 2: I introduced a sidebar that opened when you selected BRX, giving some information. This felt clunky to users and the two-sidebar view was distracting.
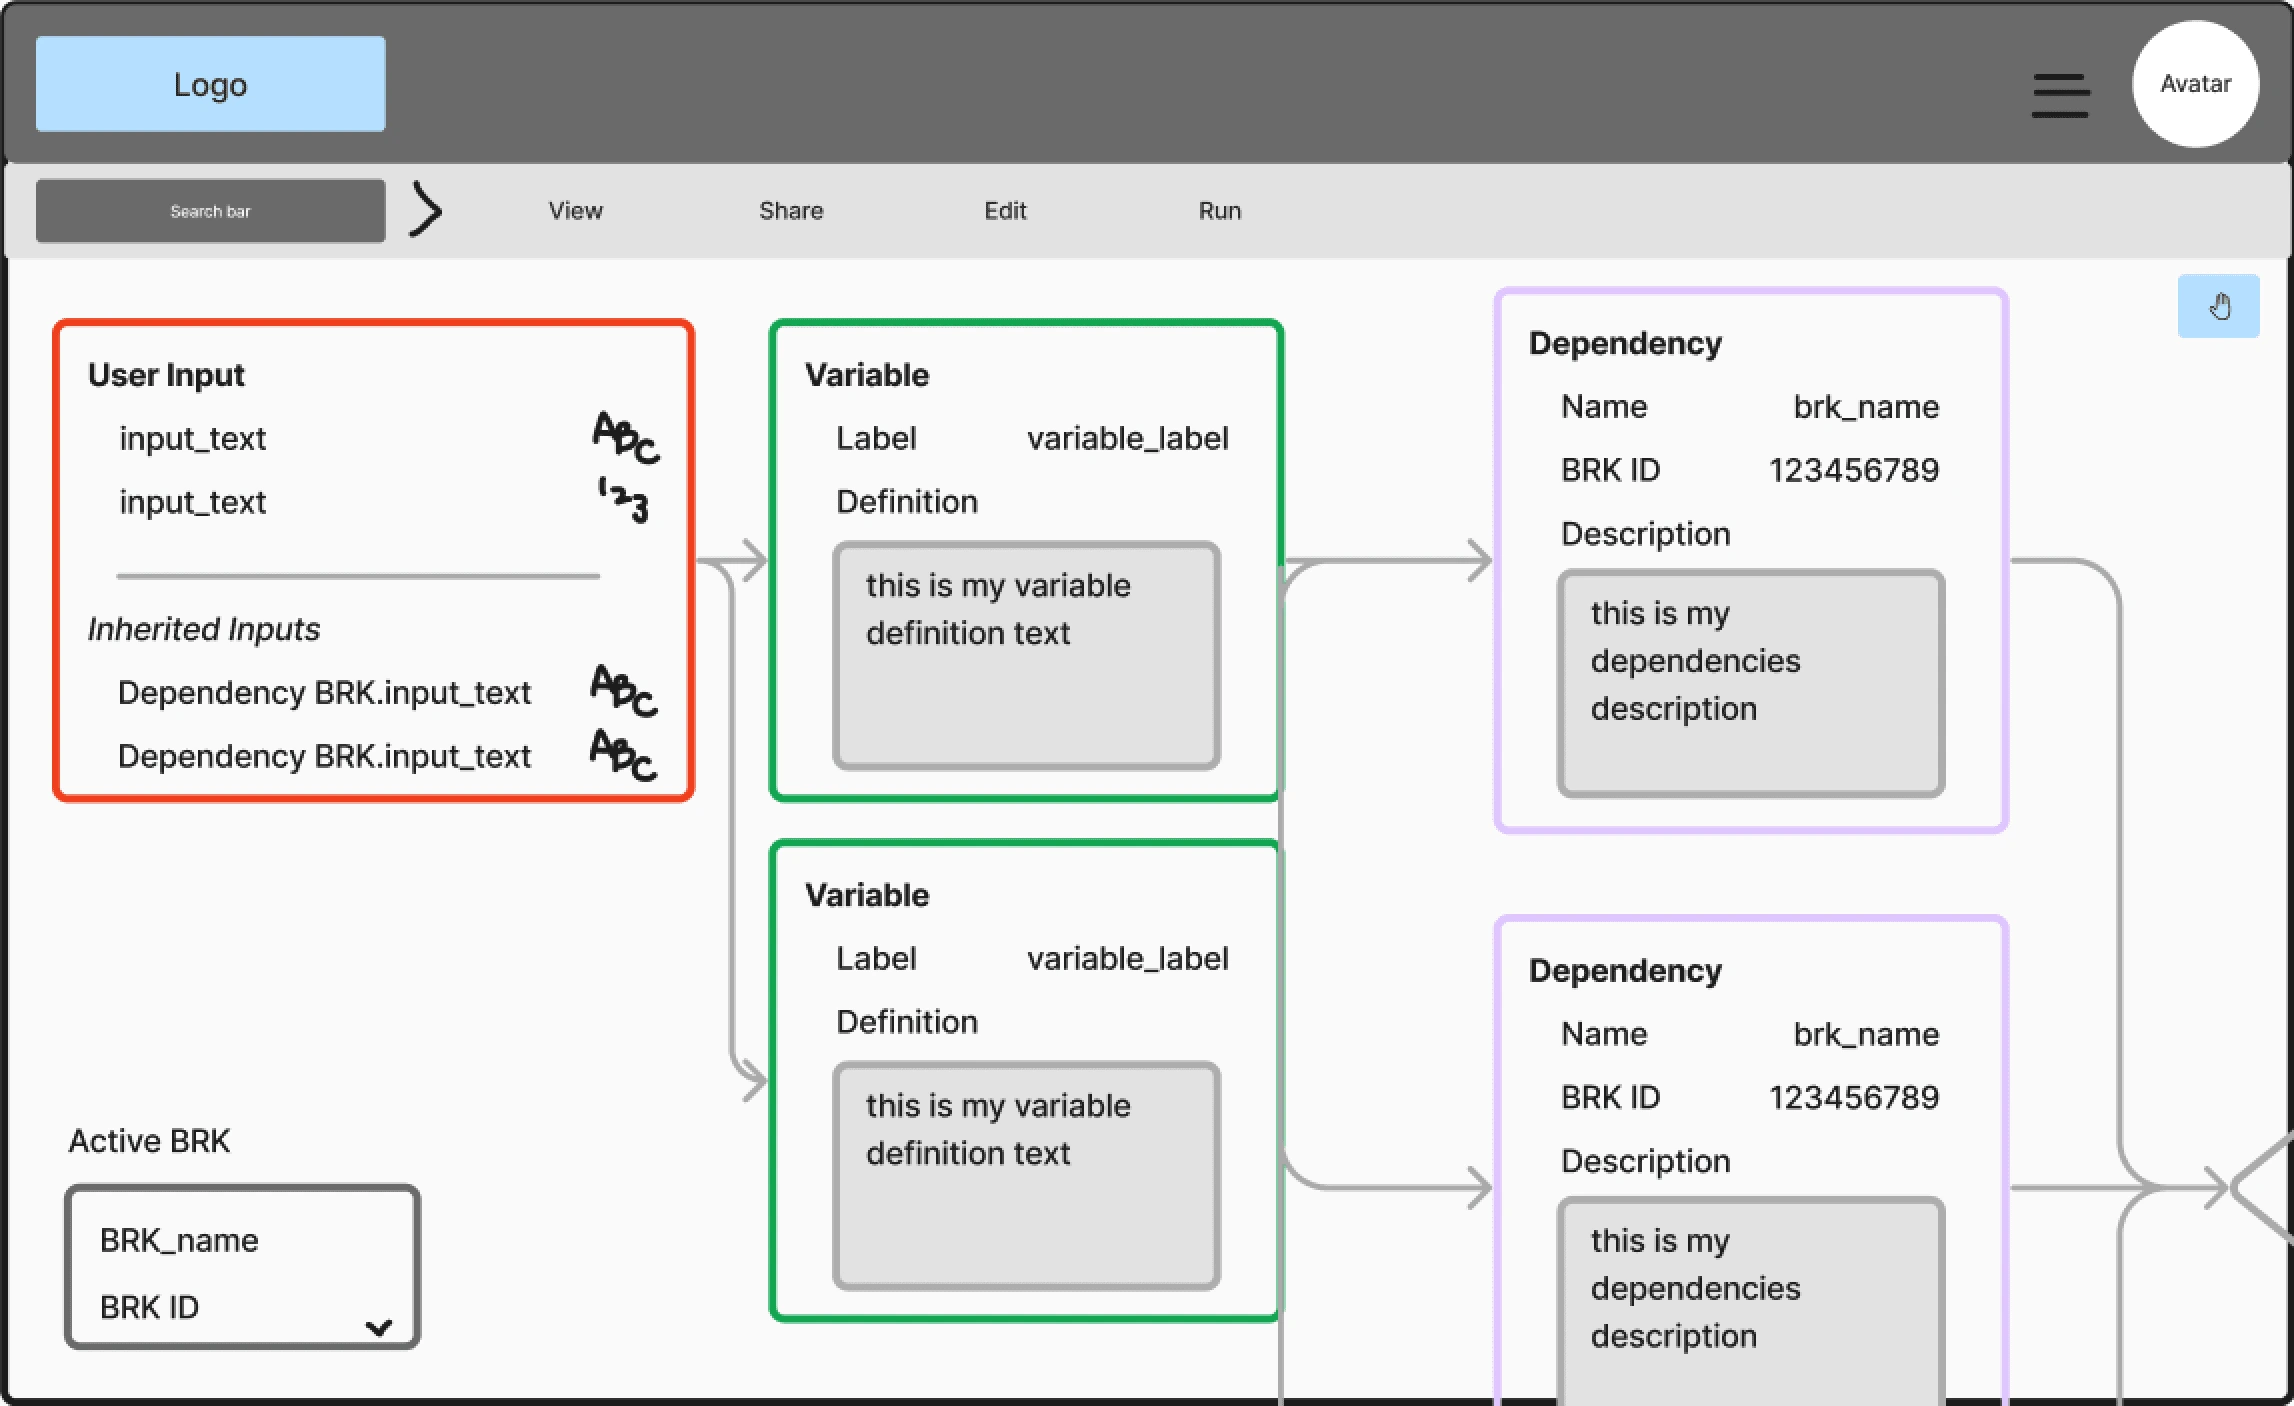
Version 3: I moved the navigation to the top, which provided more flexibility for organization. I also tried to put more of the information directly onto the screen for the BRX. I was unsure how this would be received by developers, as it's visually quite dense. We learned that this density was actually a benefit, as that was really their core goal when using this tool. It's also a paradigm they are used to from other visual mapping tools.
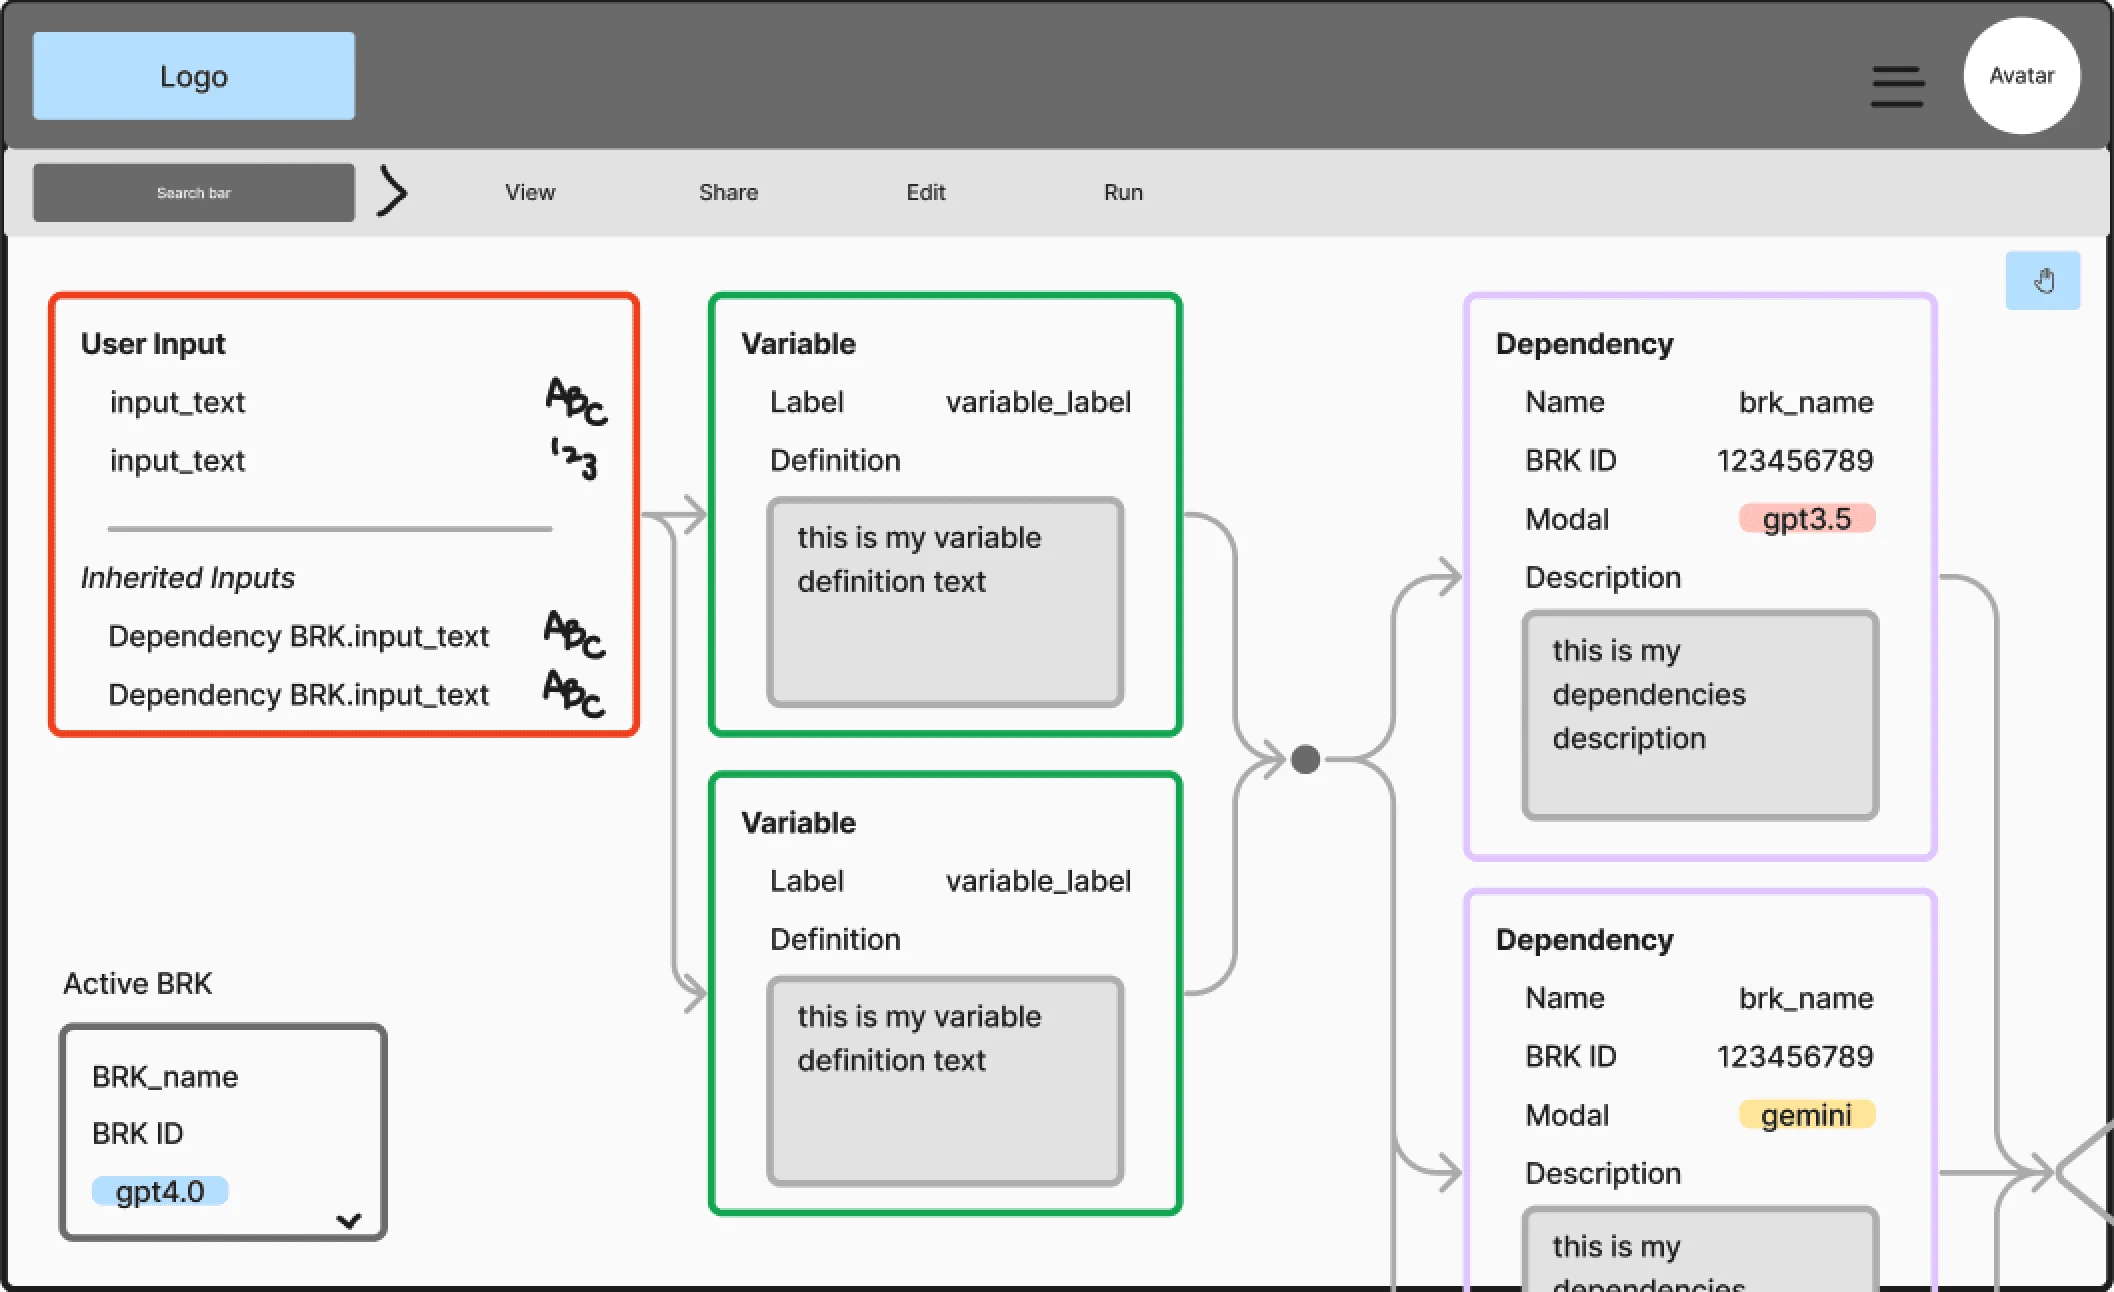
Version 4: I knew we were finally on the right track, so I tuned this up by increasing the information density of the blocks by adding color coding, and show more clearly how different blocks relate to each other.
Implementation
After we had landed on a version to implement, I scaled it up to high fidelity mocks for engineering hand-off. As the product manager and designer on this project, I used design documentation directly in Figma, as well as lots of Loom videos to articulate the product flow and design requirements to the engineering team.
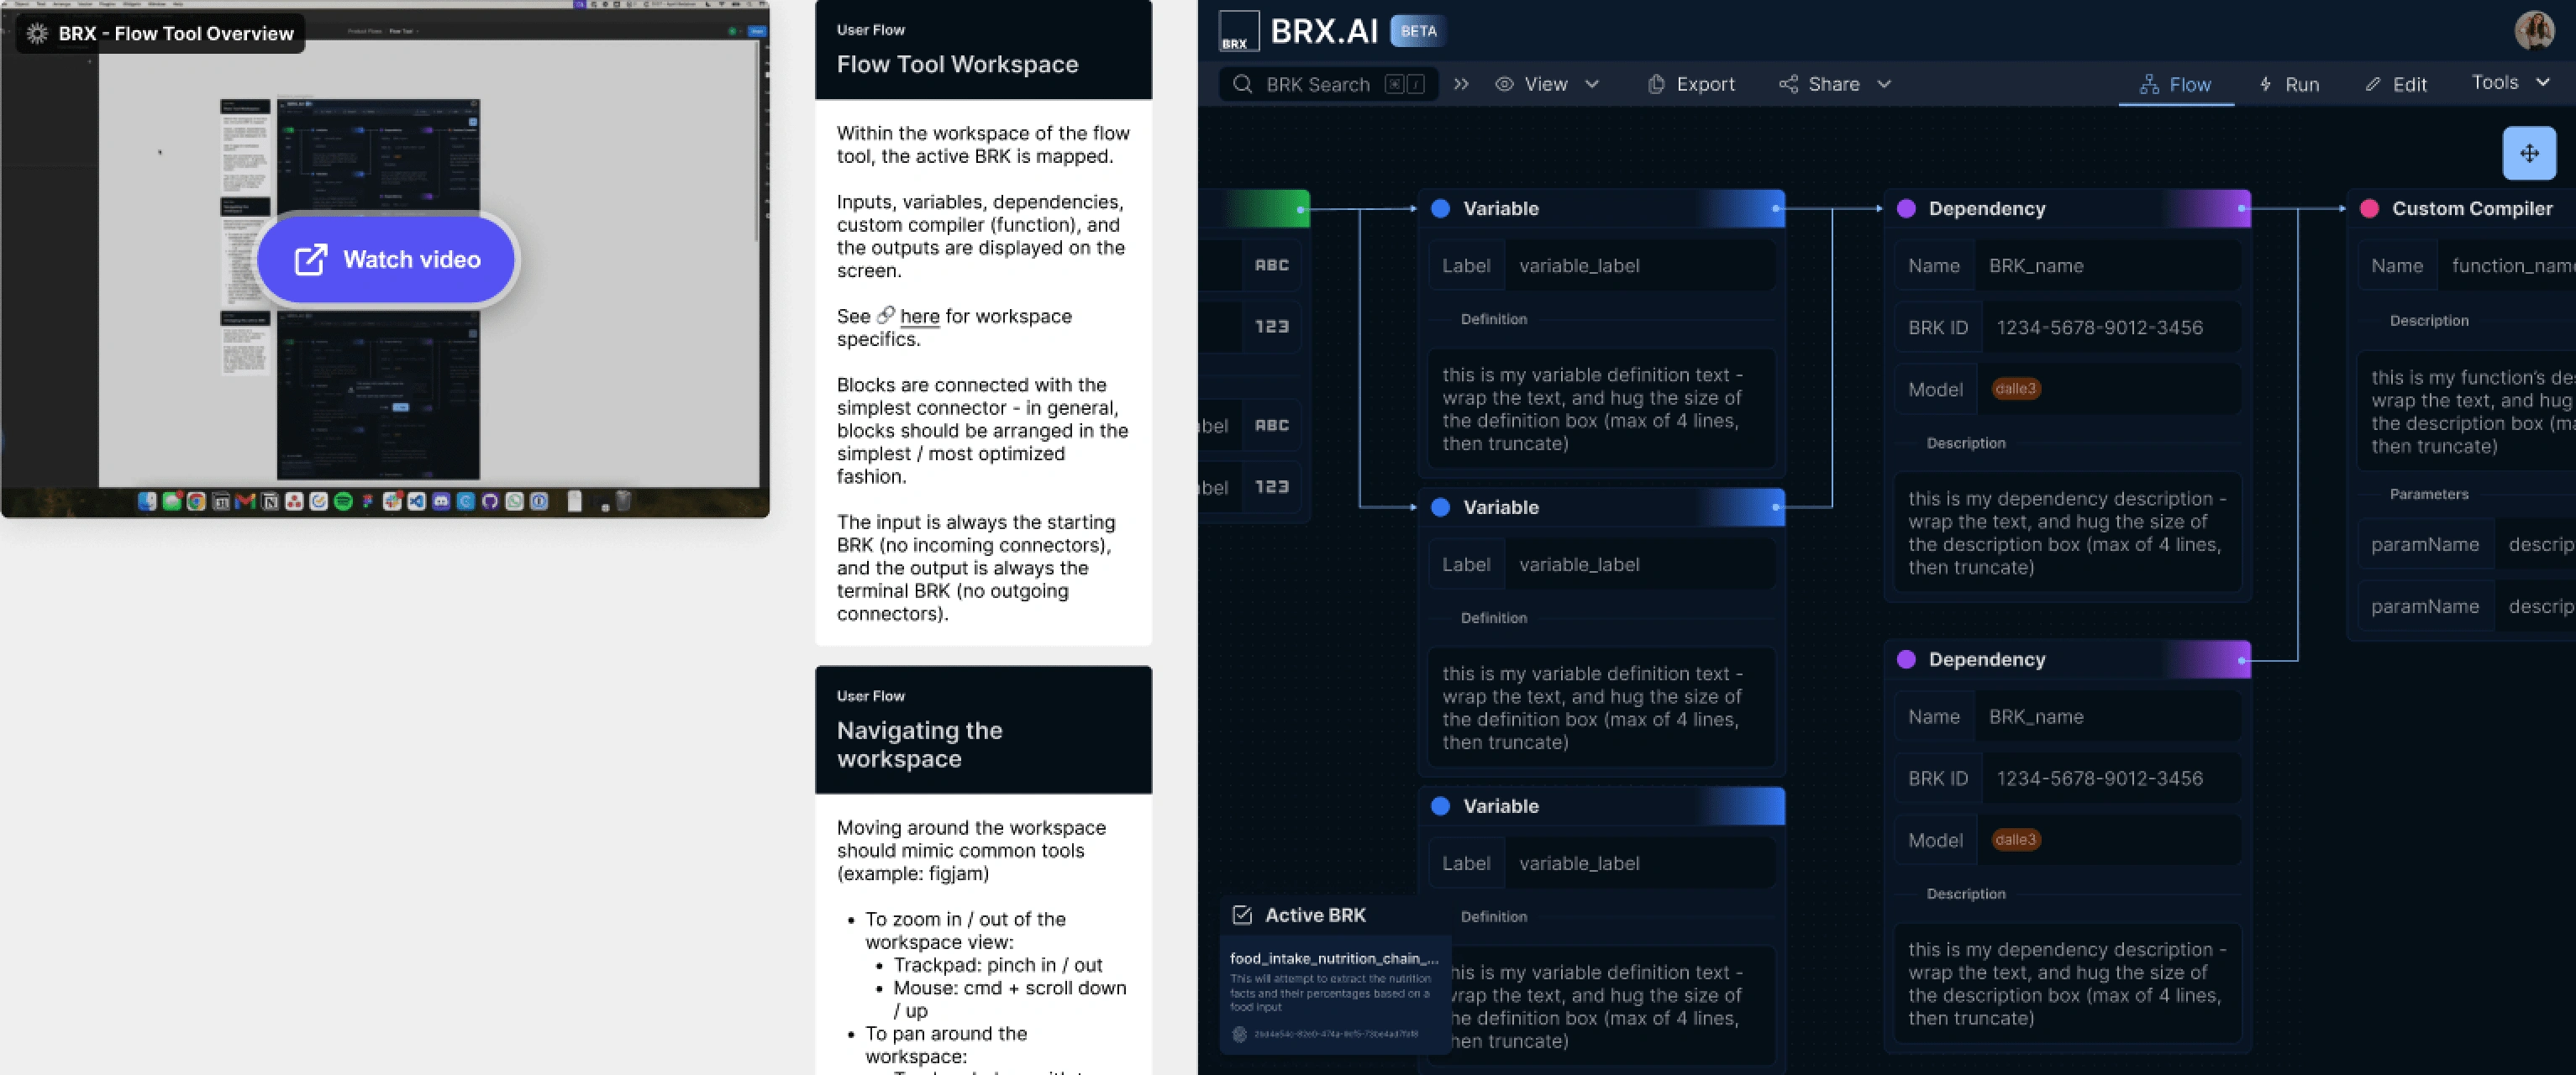
Example of high fidelity mocks and documentation in Figma, including written flow mocks, links to components, and Loom video
Results & Impact
The flow tool was shipped successfully, and has quickly become the most-used tool in the platform. This highlights its value to developers. Positive feedback from users underscored the tool’s intuitive design and effectiveness for visualizing BRX chains.
Onboarding
Recognizing the complexity of BRX AI's platform, we needed an onboarding process that would effectively guide new users. BRX is meant to be a self-serve platform, but the product had a high churn rate, and we received feedback that users had to rely on documentation a lot in order to get value from the product.
Research & Discovery
I led a workshop with key stakeholders, including the CEO, COO, and lead engineer, to identify core values, understand user motivations, and define activation metrics. This foundational understanding was crucial for designing an onboarding experience that resonated with users.
After this workshop, I created a flow diagram of the onboarding process, highlighting critical UX blockers that needed resolution. We prioritized these blockers, and began addressing them in order to pave the way for a smoother user journey.
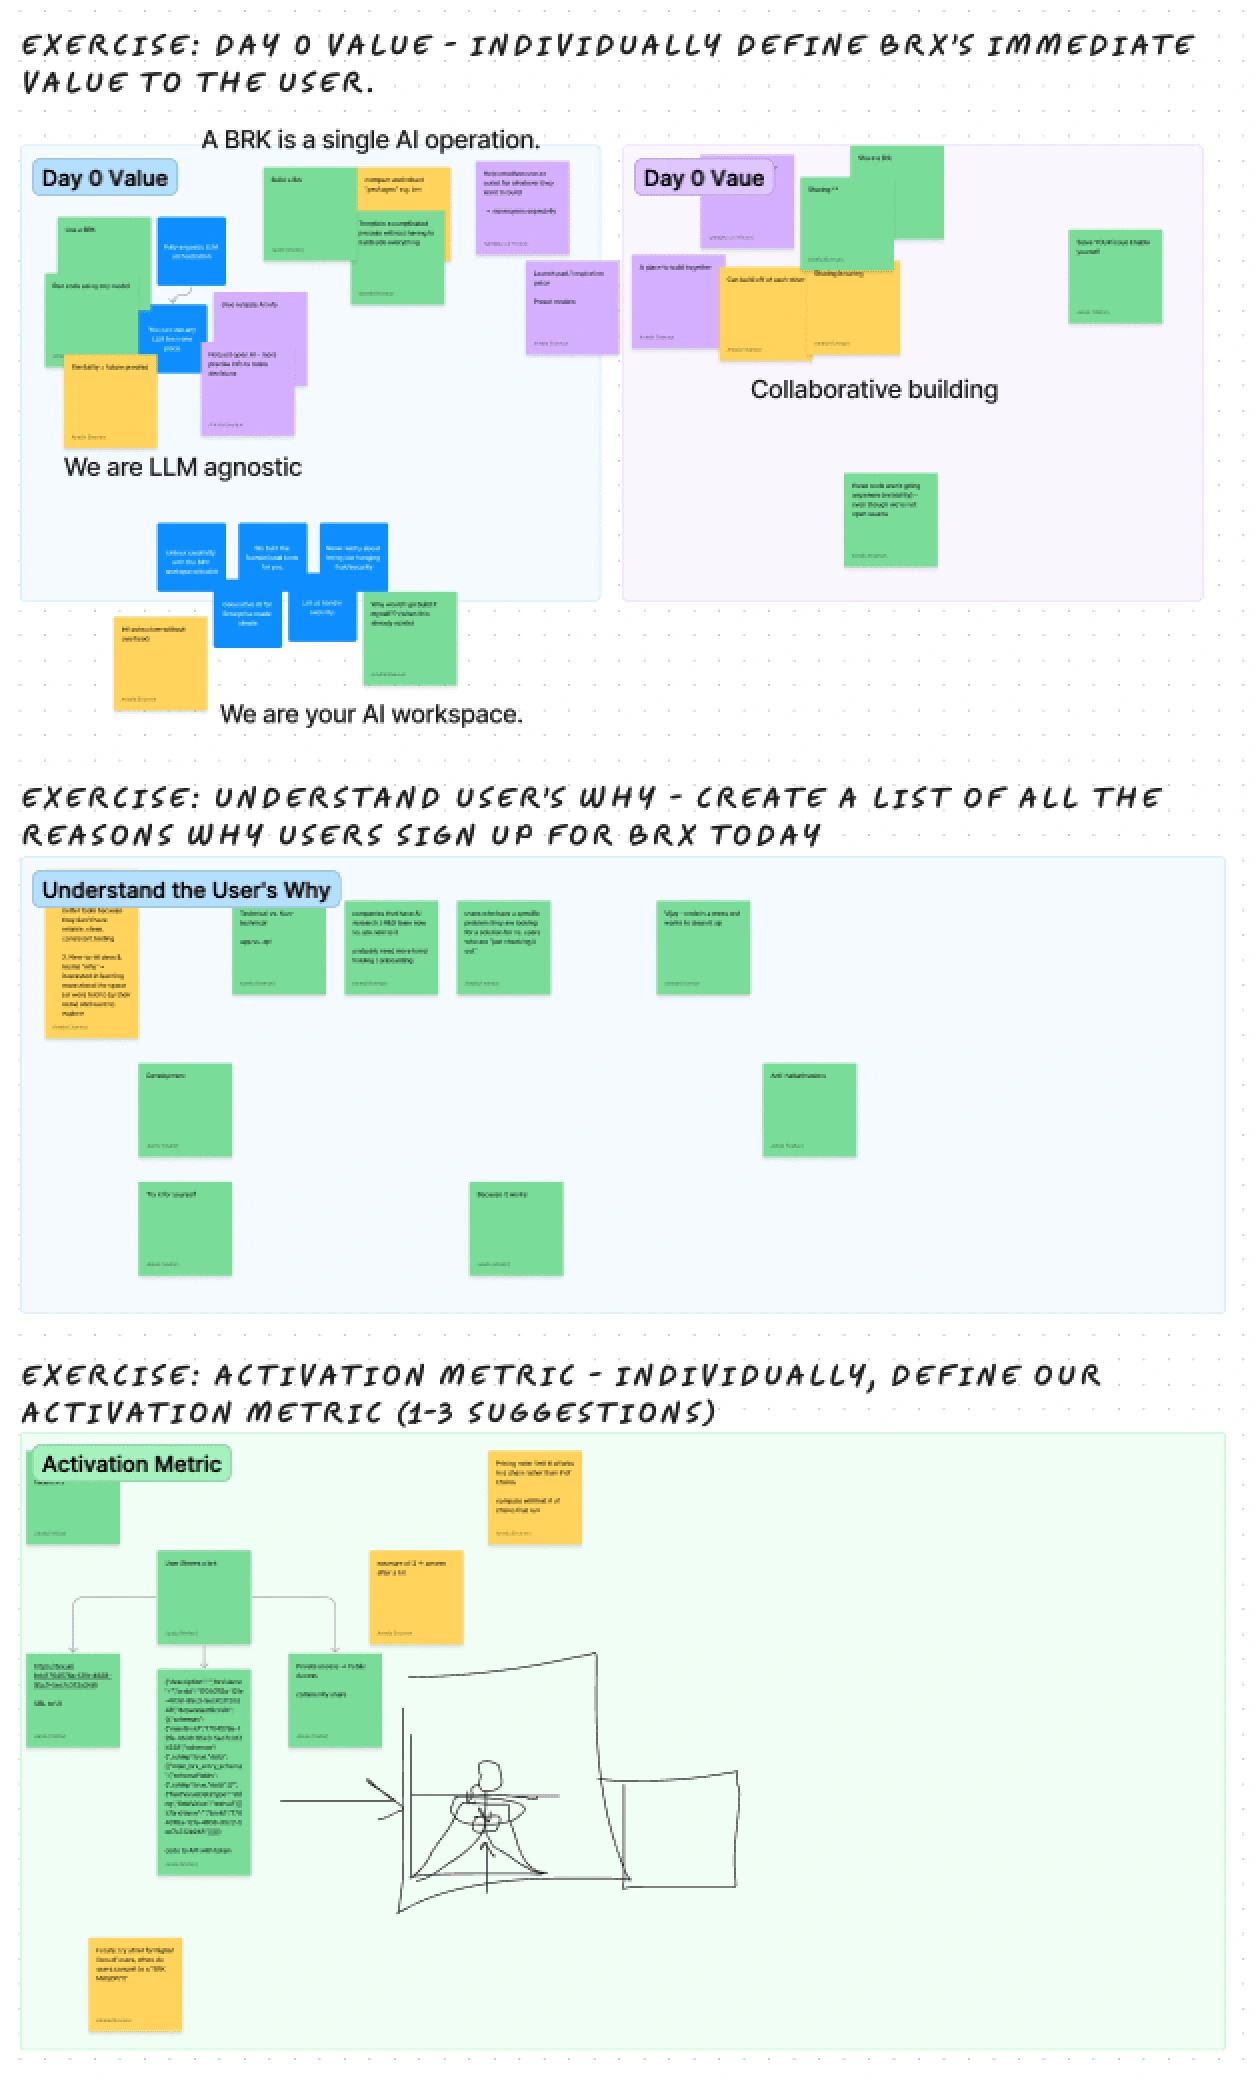
FigJam board for workshop exercises with the team - we each made notes individually, and then grouped them according to theme. This was one of many product strategy workshops I led with this team in order to define their product vision, roadmap, monetization strategy, and more.
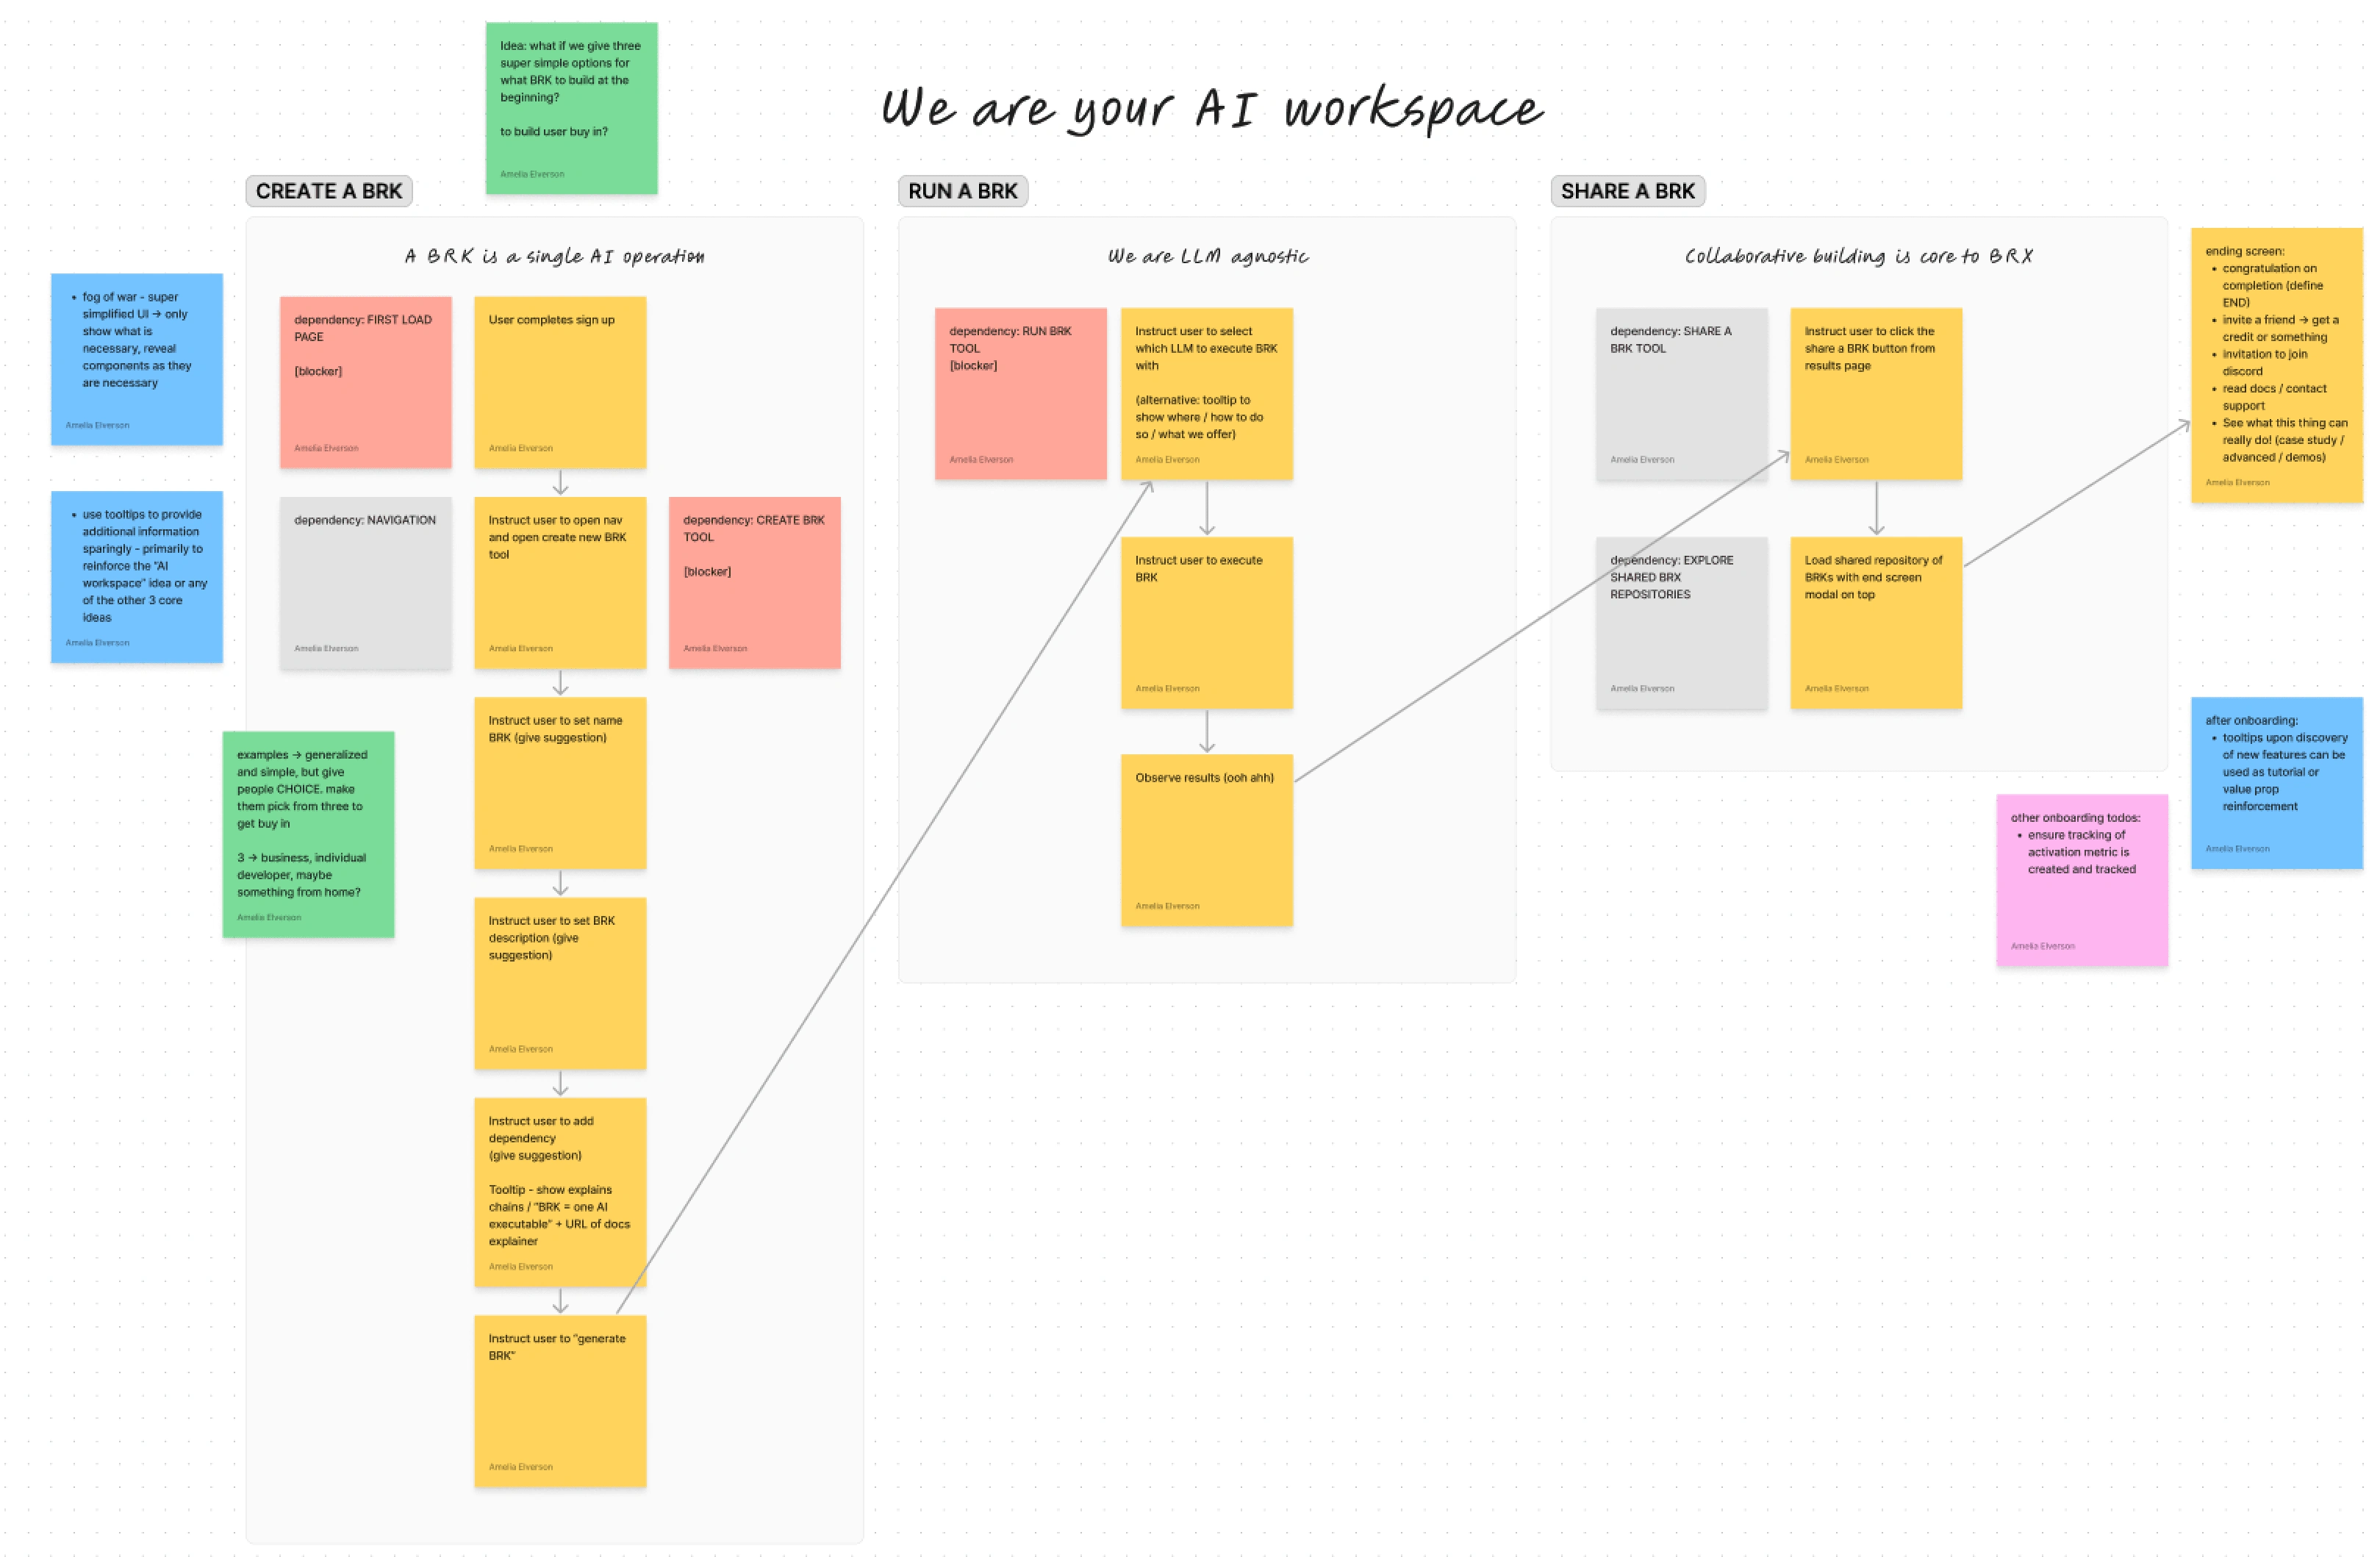
Flow diagram of onboarding, highlighting low and high priority blockers, and open questions for user research
Ideation & Prototyping
The goal was to help users quickly grasp the platform's fundamentals without extensive documentation. I created low fidelity wireframes that were tested with users unfamiliar with the platform, providing actionable feedback that informed the final design.
As we discussed mocks with users, we realized there were two primary user types. Type 1 are first time AI developers - they were much more focused on getting the basics, then getting to “play” with the tool itself. Type 2 are AI experts, who grasped the basics quickly, but were going to want to deep dive on the more advanced features of the platform. They were looking for specific feature queues that would suit their needs, and the ability to skip step-by-step onboarding in favor of reading documentation.
We landed on an onboarding flow that introduced key concepts gradually, and offered users quick links to deeper documentation (which we also beefed up with video guides and tutorials with examples).
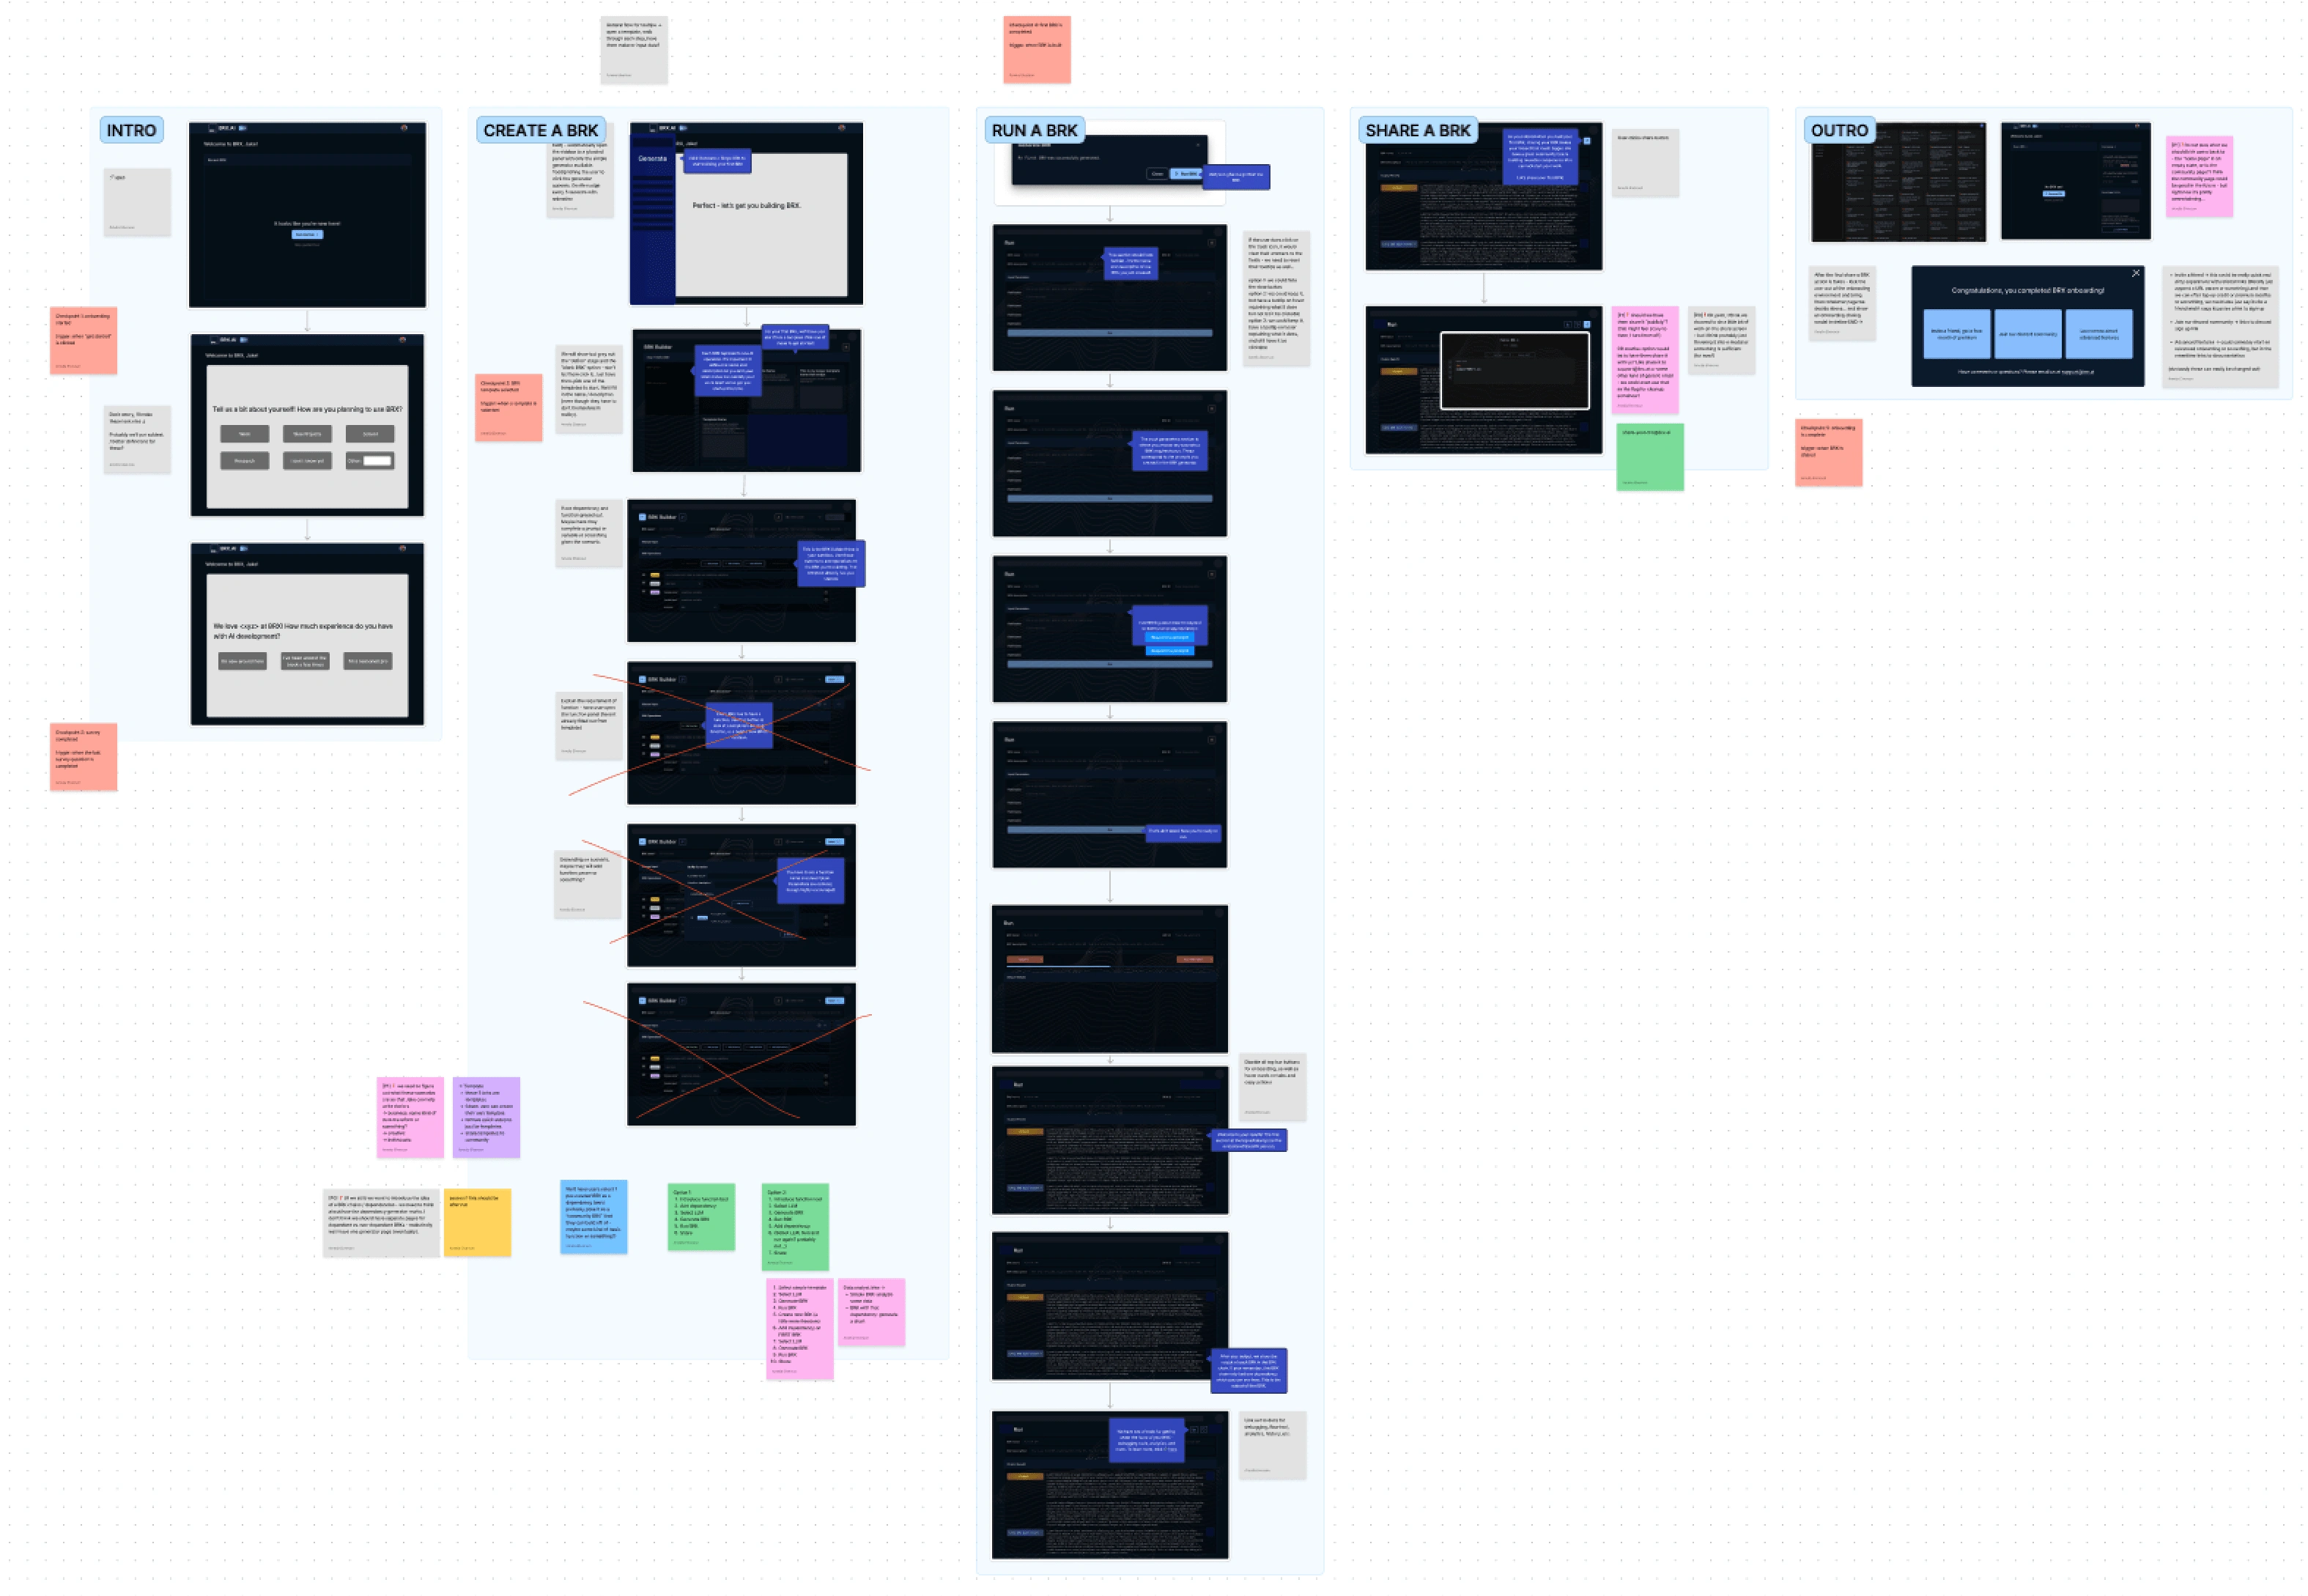
Example of one iteration during a user research phase - I wrote feedback items and open questions to share with the team, as well as iterated live with the rest of the team.
Implementation
The implementation of the new onboarding occurred in tandem with a lot of other product changes (especially to those “blockers” we discovered in the flow mapping). Because of this, I want to keep the design modular, and worked with the engineering team to ensure the implementation was flexible in order to keep up with the platform’s evolution.
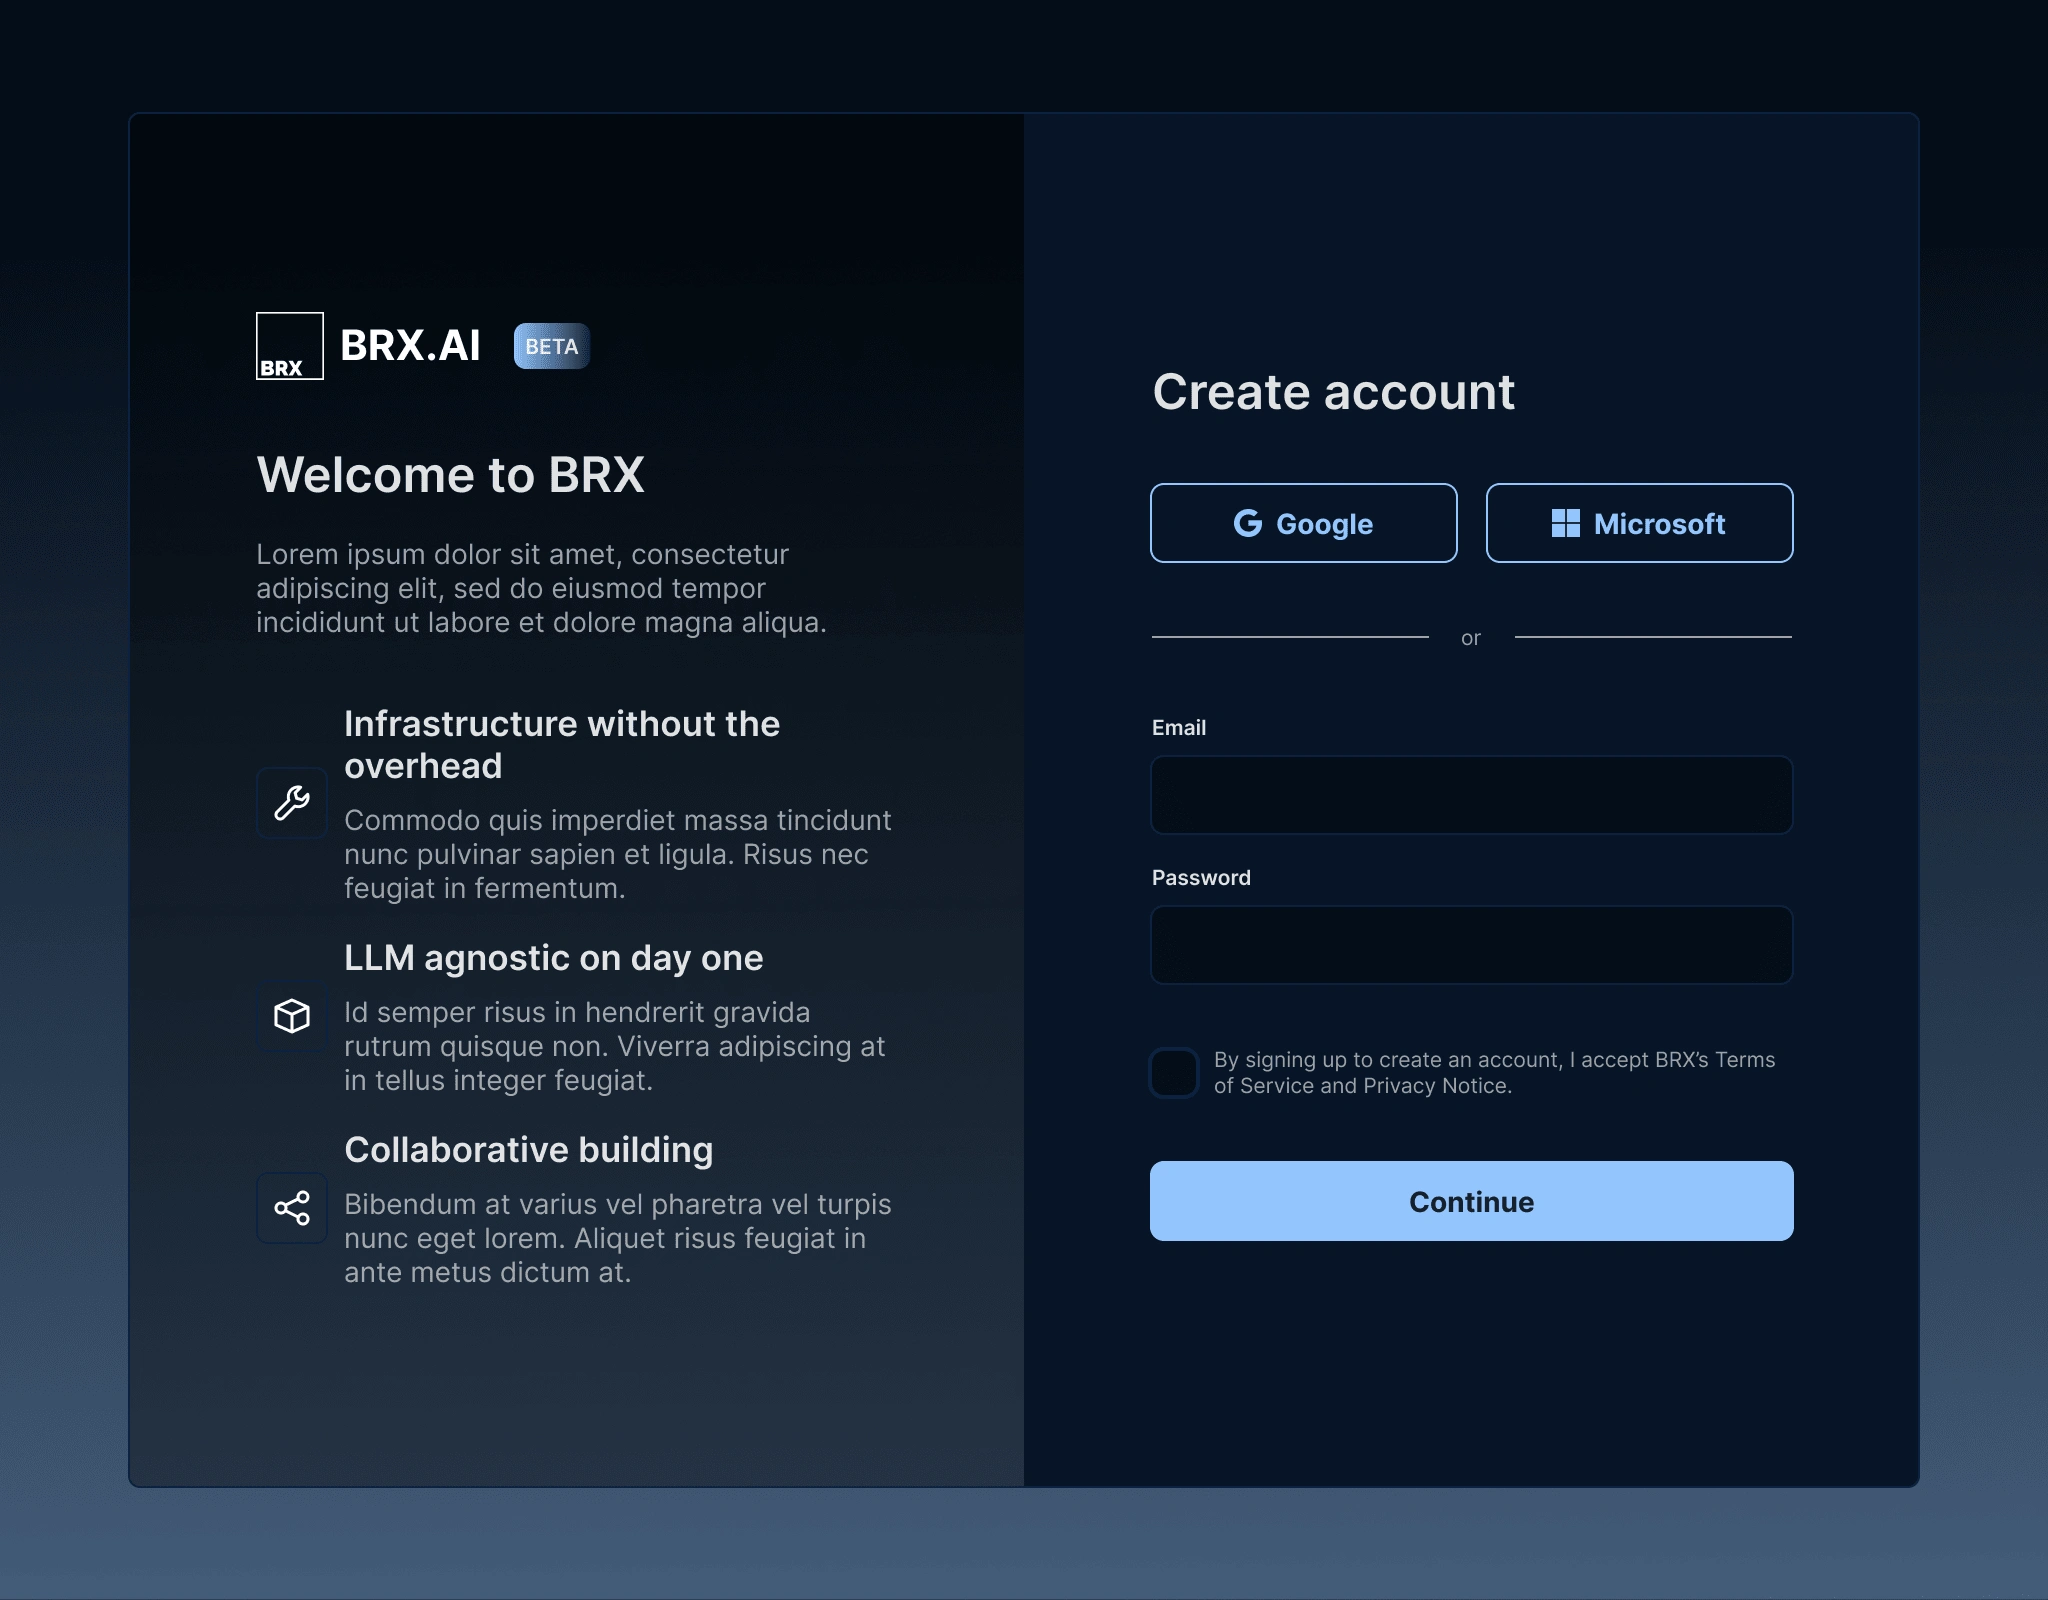
Create account screen - the first thing users see when they decide to sign up
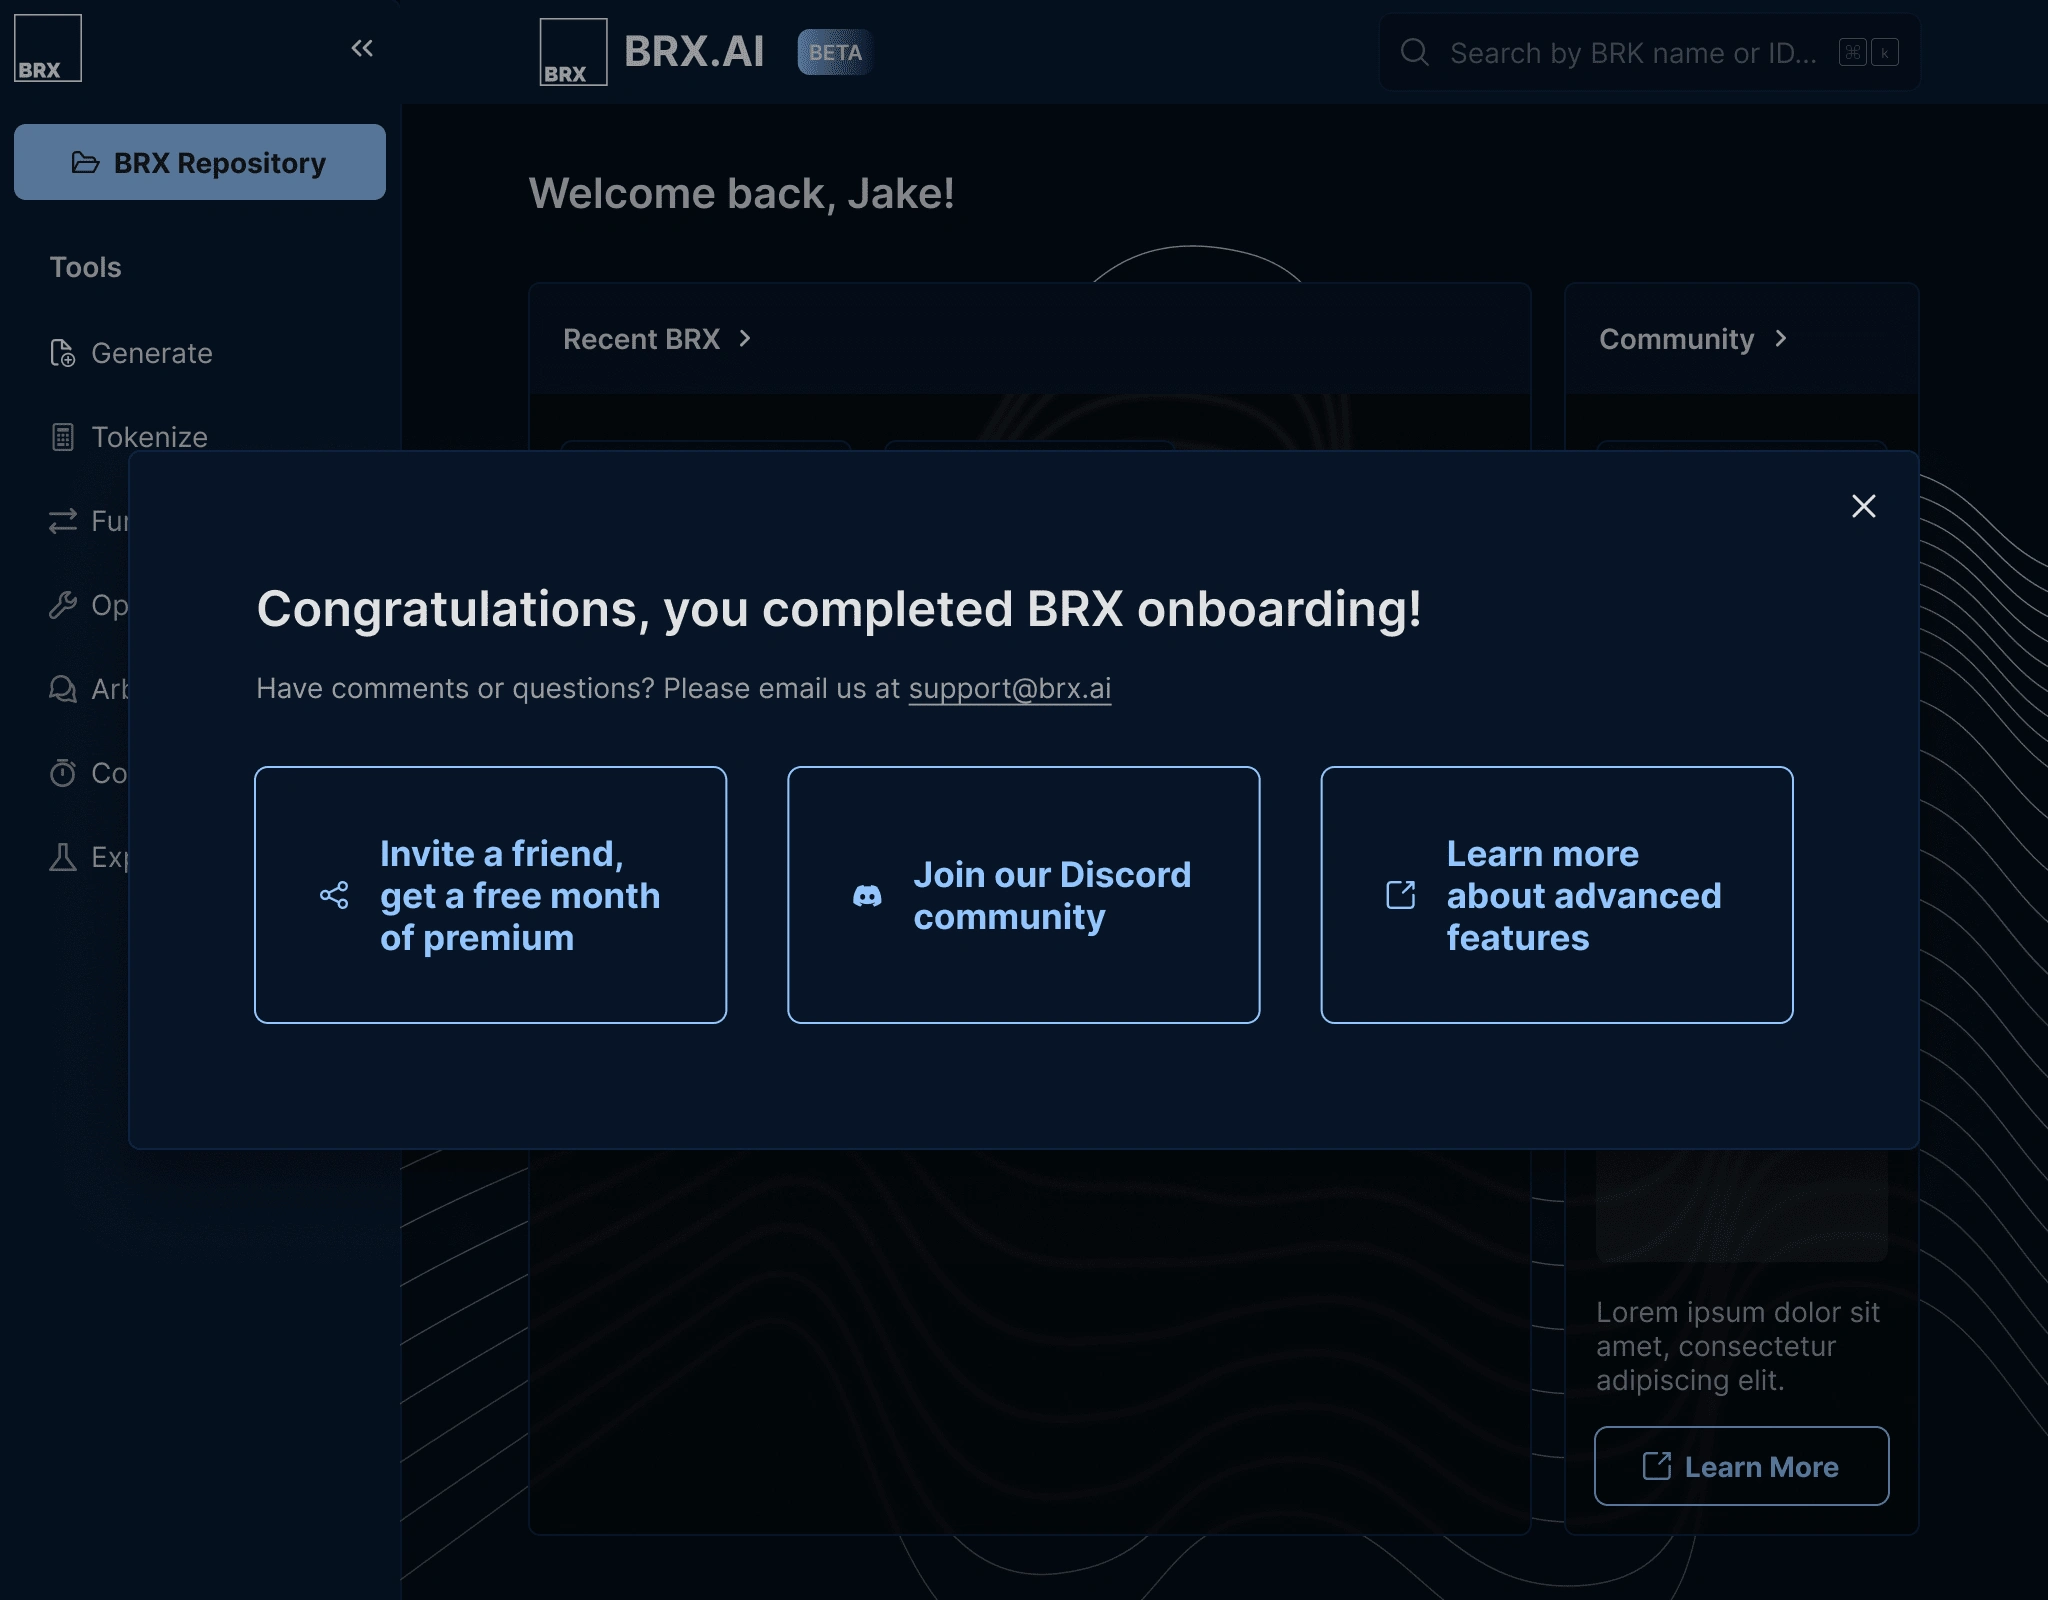
Key closing screen that encourages inviting collaborators, getting involved with the BRX community, and diving into the docs. Signaling the end of onboarding allows users to get excited about the new product, and move from learning mode into exploration mode.
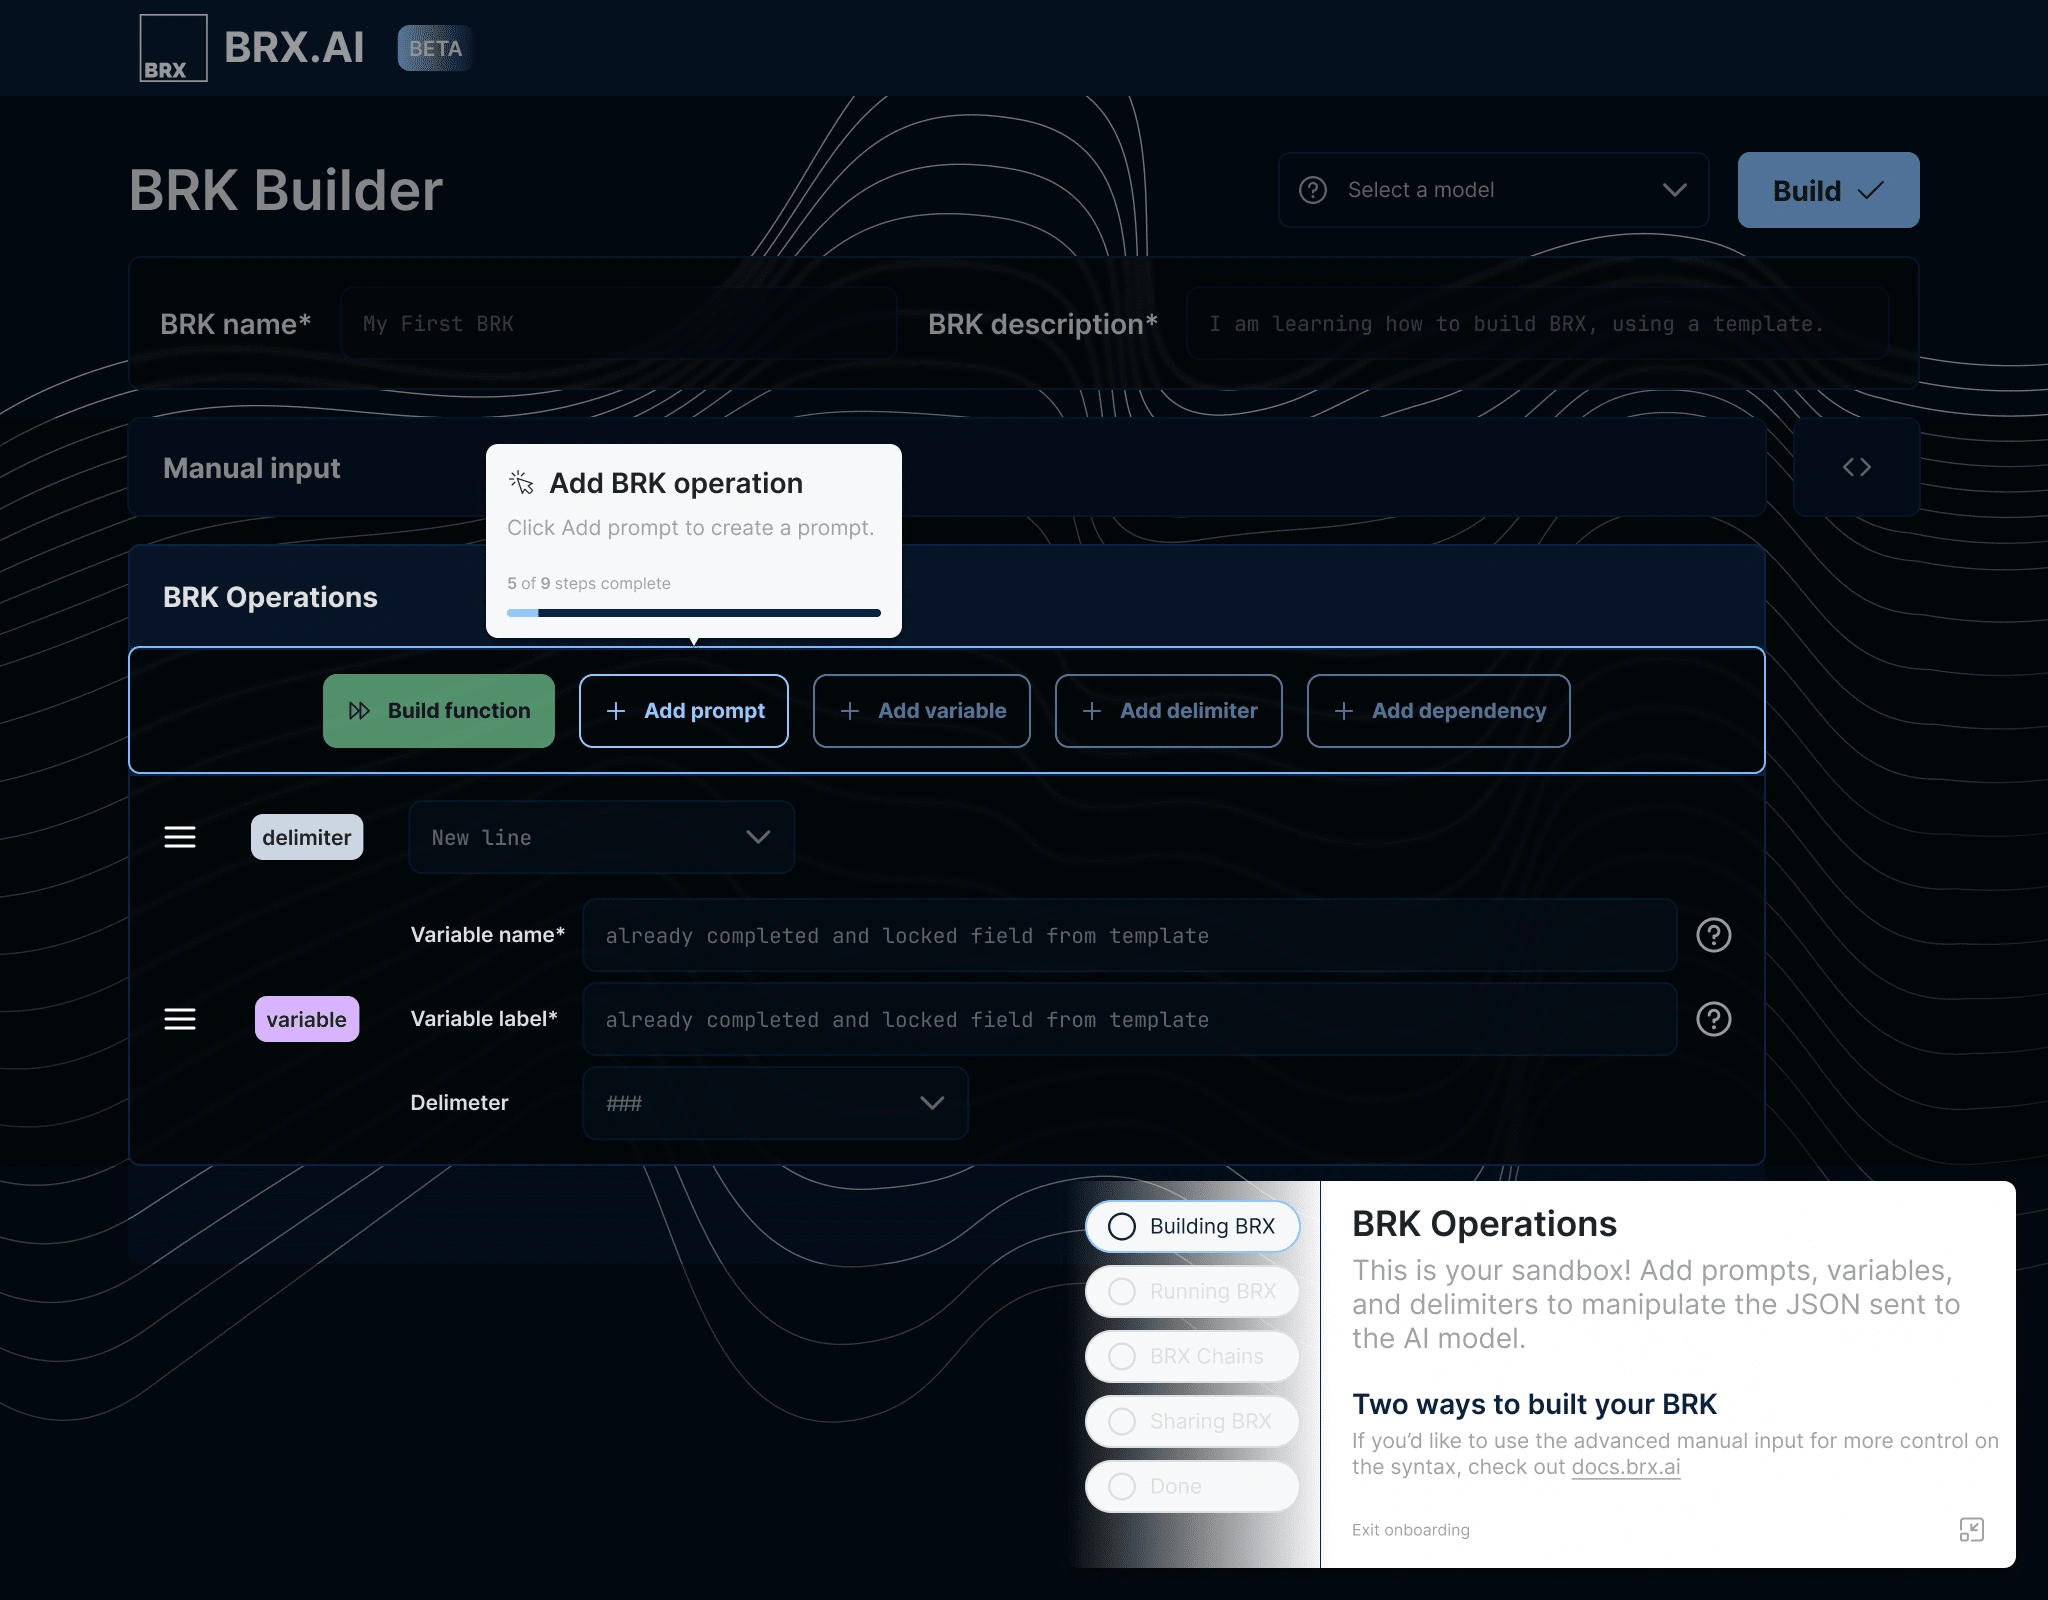
An example of the modular design - I structured the onboarding into short "chapters" based on topic - users could skip between these, as well as read more if they wanted to. The tool tips are connected to components on screen, so they can easily be changed and reordered.
Results & Impact
Users have consistently reported better understand of the platform, and being able to get value from the product in the first few minutes of the product (instead of hours or even days, as observed previously). Since shipping this, the team has seen retention numbers steadily increase in preparation for their release out of beta.
Conclusion
These projects exemplify the power of user-centered design and strategic collaboration in creating impactful AI development tools. The success of the flow tool and onboarding process at BRX AI demonstrates the importance of understanding user needs, iterative design, and seamless implementation in driving innovation and user satisfaction.
Like this project
Posted Jul 9, 2024
I was hired as a part-time CPO at BRX AI, leading product strategy and design for the team.
Likes
0
Views
38


