Website Traffic & Engagement Dashboard Development
Chaya Chaipitakporn
Website Traffic & Engagement Dashboard (GA4)
📍 Tool: Looker Studio (Google Data Studio)
👤 Audience: Marketing teams, SEO/ads managers, growth analysts
🎯 Objective
This dashboard provides a 360° overview of web traffic, engagement, and audience behavior using GA4 data. It supports marketing performance reviews, channel ROI analysis, and user experience insights for growth teams.
📊 Key Metrics & Visuals
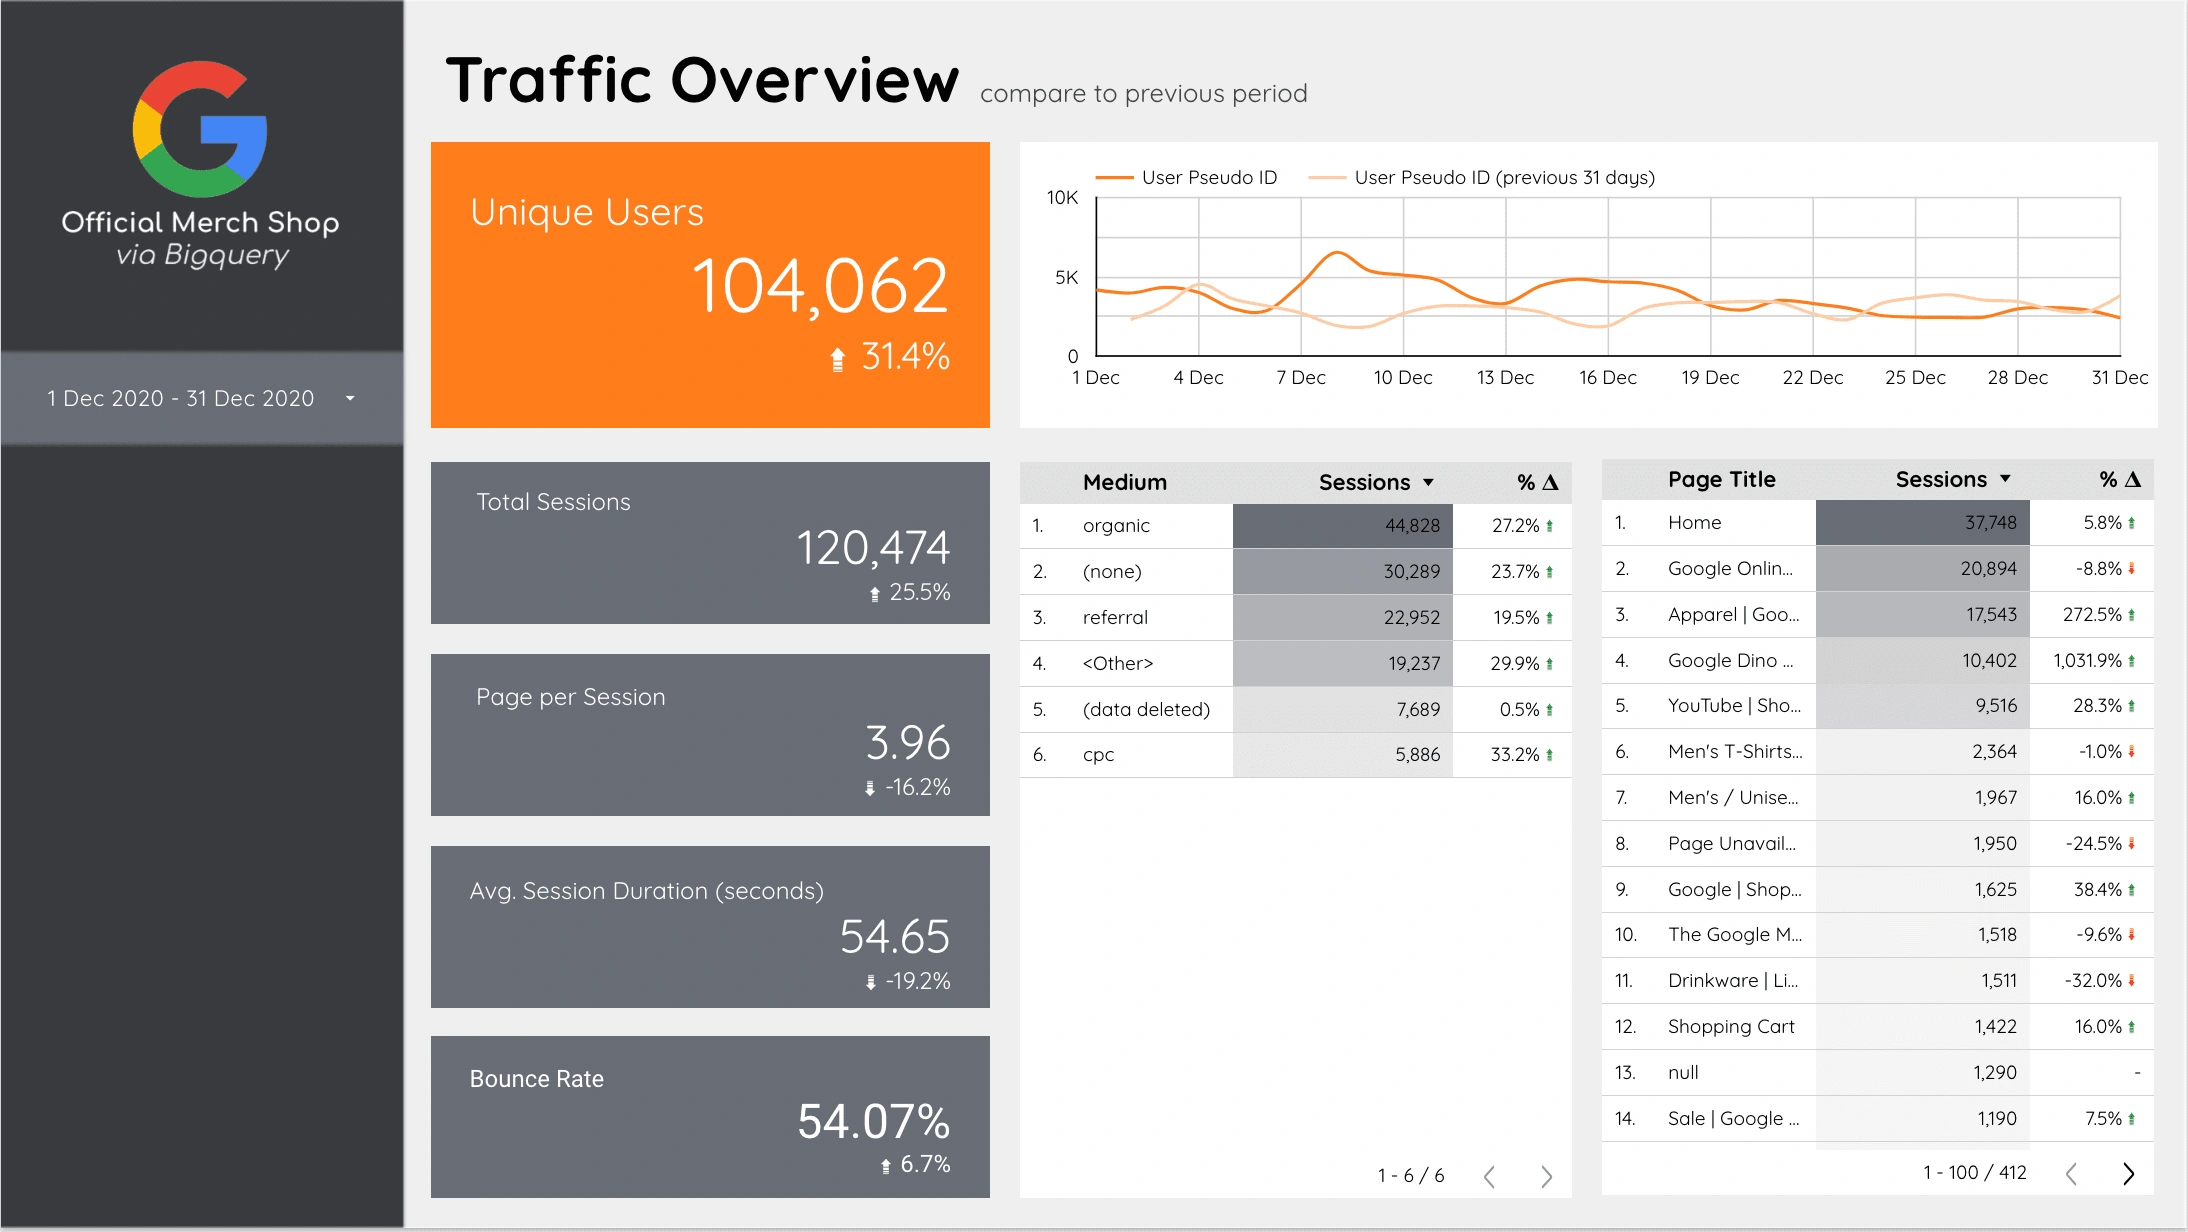
🟧 Traffic Overview
Unique Users
Total Sessions
Page per Session
Avg. Session Duration
Bounce Rate
Top Mediums
Top Pages by Sessions
User Activity Trend
🟧 User Engagement Section
Unique Engaged Users
Average Event Count (scroll, click, view)
% Scrolled
Event Breakdown
Top Pages by Engaged Users
Engagement Trendline
🟧 User Demographics Section
Top Medium & Source
Users by Country (Heatmap)
Users by Device
Users by OS
🧠 Insights Delivered
Track traffic spikes and dips by medium, source, and campaign
Analyze user engagement behaviors across device types
Compare content performance by page (scroll %, click activity)
Monitor geo-distribution and device trends for UX strategy
Identify bounce rate or session length drops to improve retention
Guide SEO, paid media, and product page improvements
🛠️ Skills Demonstrated
GA4 event model comprehension
Looker Studio dashboard architecture
Engagement funnel metrics design
Source/medium attribution analysis
Audience breakdown & UX signal tracking
Like this project
Posted Apr 18, 2025
Developed a GA4-based dashboard for web traffic and engagement analysis.
Likes
0
Views
4