Sales Performance Dashboard
Chaya Chaipitakporn
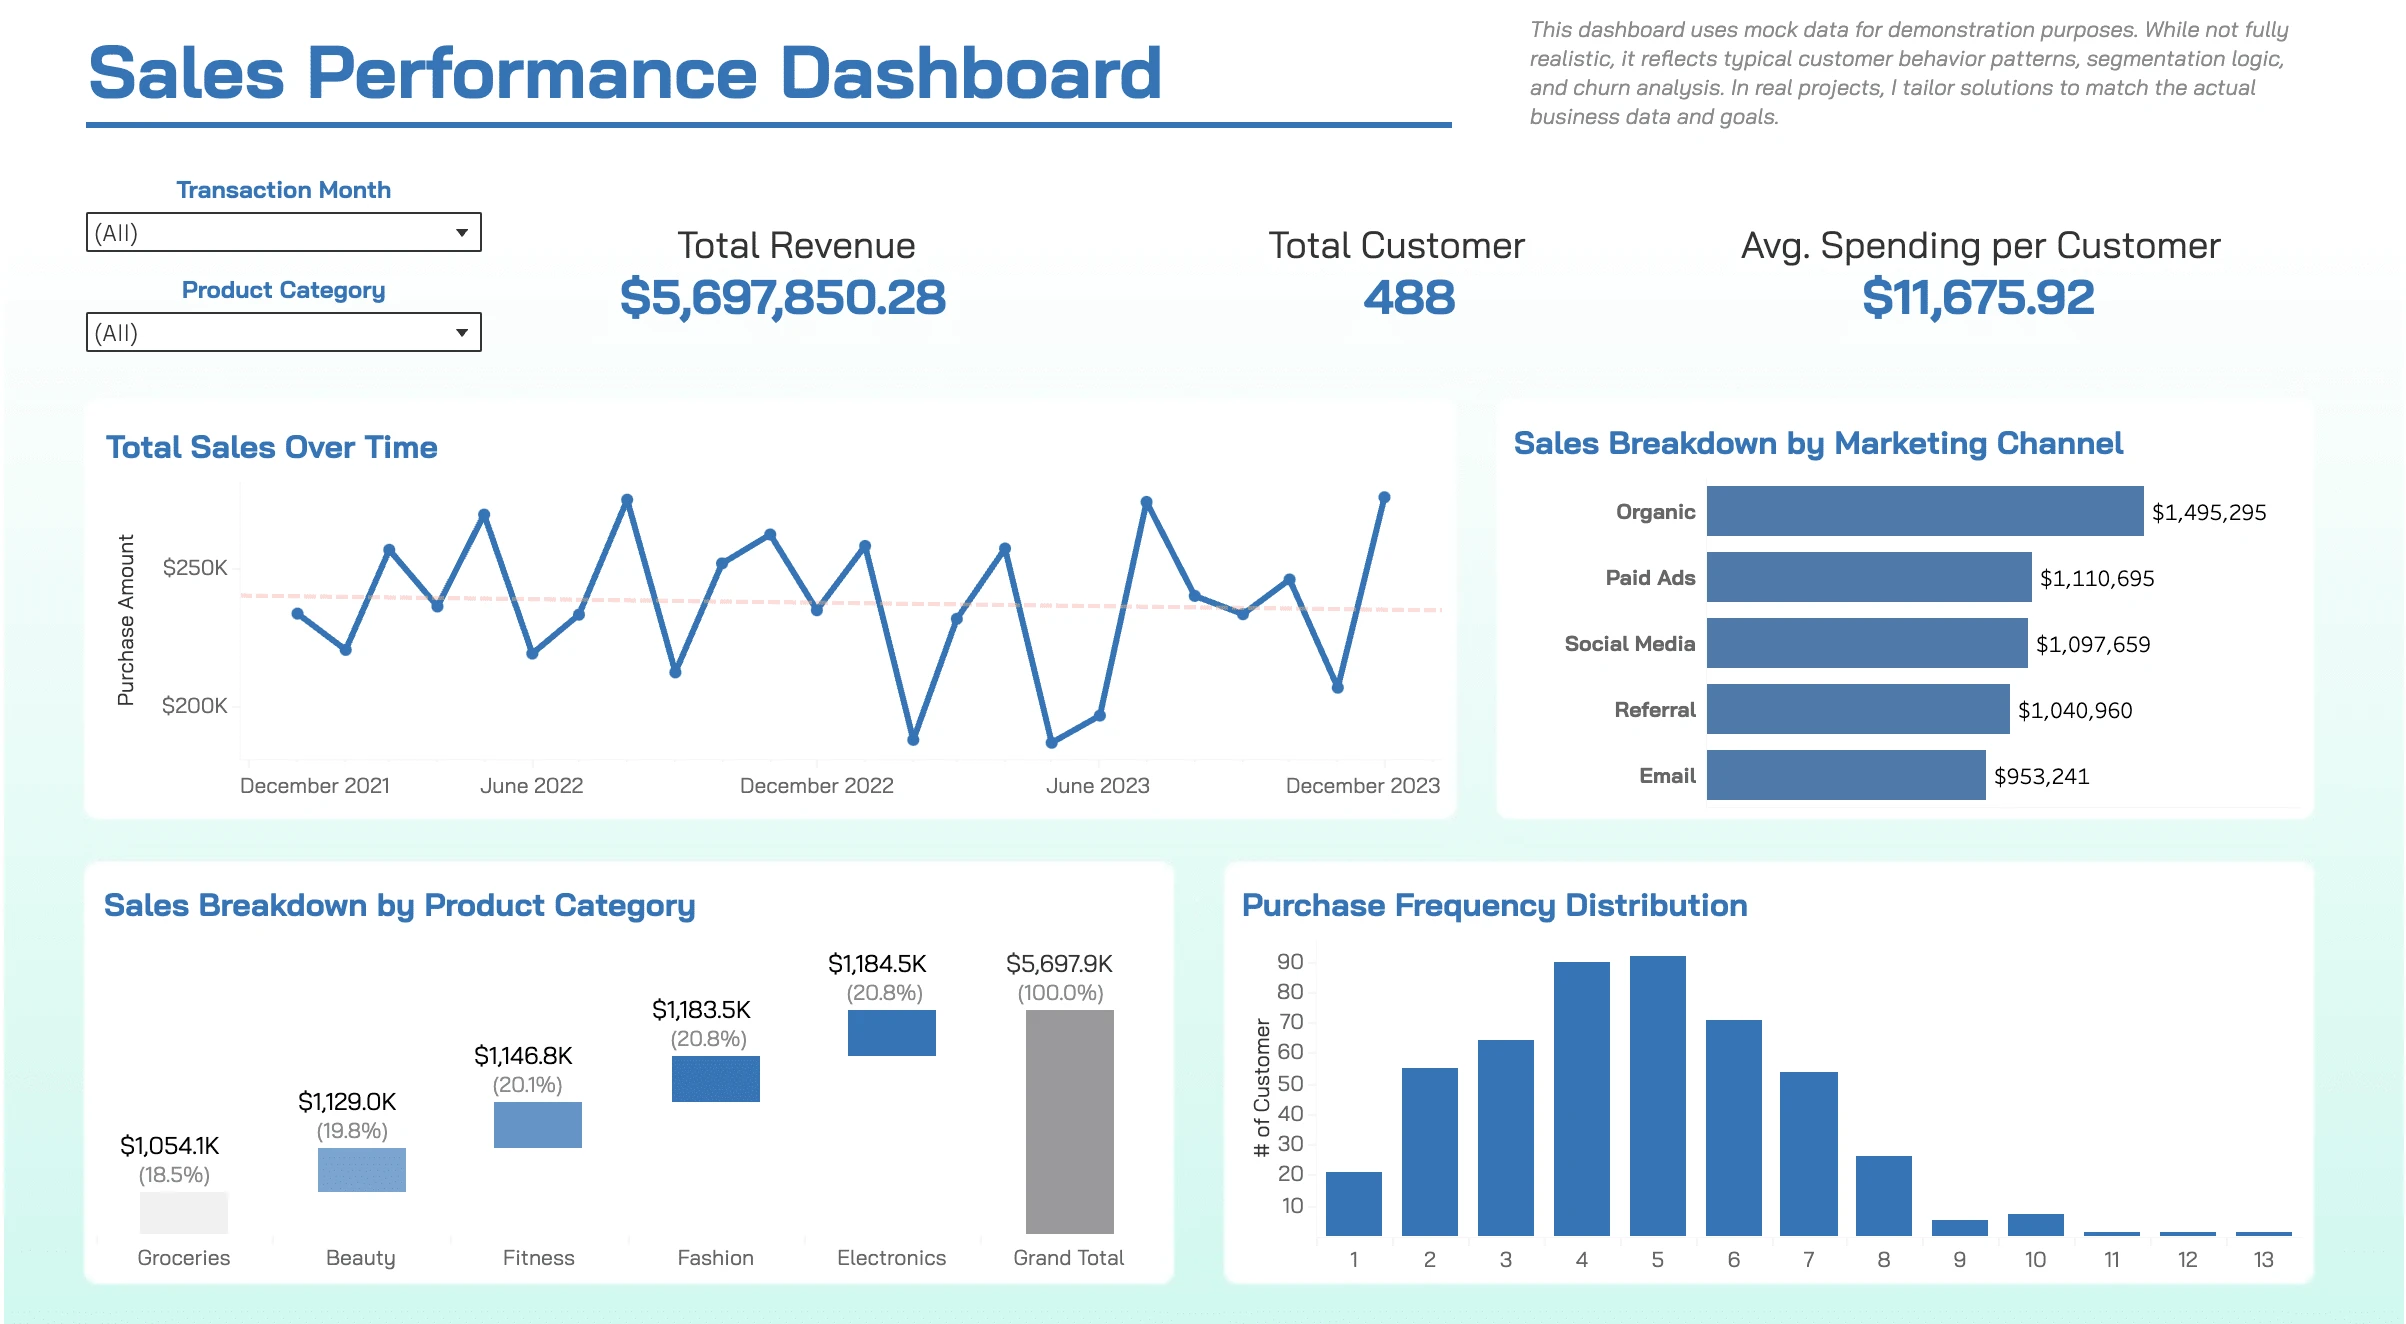
Sales Performance Dashboard
📍 Tool: Tableau Public
👤 Audience: Business owners, sales managers, product leads
🎯 Objective
This dashboard provides a real-time view of sales performance, helping decision-makers identify top revenue channels, monitor category performance, and optimize marketing efforts based on actual customer behavior.
📊 Key Metrics & Visuals
Total Revenue
Total Customers
Average Spending per Customer
Time Series Chart: Sales Over Time (Monthly trend)
Sales Breakdown by Marketing Channel: Organic, Paid Ads, Social Media, Referral, Email
Sales by Product Category: Groceries, Beauty, Fitness, Fashion, Electronics
Purchase Frequency Distribution: Histogram of the number of purchases per customer
Filters: Transaction Month, Product Category
🧠 Insights Delivered
See which marketing channels generate the most revenue
Analyze seasonal patterns in sales to guide promotional timing
Identify top-selling categories and underperformers
Understand customer purchase frequency to support segmentation or loyalty strategies
Segment sales by time or category with built-in filters
🛠️ Skills Demonstrated
Tableau visualization and layout design
Business KPI definition and dashboard storytelling
Time-series trend analysis
Marketing & product performance insight modeling
Customer behavior visualization (frequency distribution)
Like this project
Posted Apr 18, 2025
Created a Tableau dashboard for real-time sales insights.
Likes
0
Views
2