Funnel Drop-Off Analysis for E-commerce
Chaya Chaipitakporn
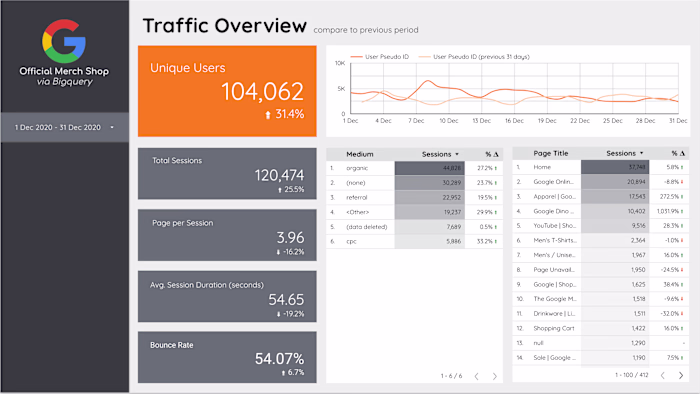
🔎 Funnel Drop-Off Analysis (GA4 + BigQuery)
Understand where users drop off—and how long they hesitate—across your customer journey.
🧩 Project Summary
A funnel analysis using GA4 and BigQuery to uncover conversion bottlenecks and time delays across devices. Delivered segmented insights to prioritize UX and CRO improvements.
📌 Business Problem
The client wanted to identify why users were not completing purchases, despite high product views and cart activity. Existing GA4 dashboards showed totals but didn’t break down drop-offs or time delays at each funnel stage.
⚙️ My Approach
Queried GA4’s raw event logs in BigQuery to reconstruct the user funnel:
view_item → add_to_cart → begin_checkout → purchaseCalculated drop-off rates and average time-to-convert between each step
Segmented the funnel by device type (desktop, mobile, tablet) for better UX targeting
Filtered out extreme outliers to focus on realistic, same-session user journeys
Delivered a clean summary with business insights and action recommendations
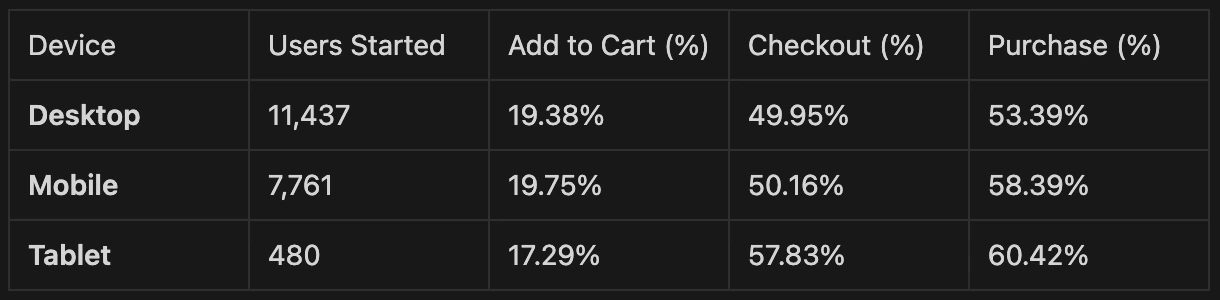
📊 Key Results: Funnel Conversion Rates
📌 Insights
Add-to-cart is the major drop-off point across all devices—only ~20% of users progress past product viewing.
Once users enter the checkout flow, conversion rates are strong, especially on mobile and tablet (over 50%).
Mobile leads in final purchase rate, indicating a relatively optimized experience.
Tablet users, while fewer in number, show the highest funnel completion rates, suggesting more deliberate or motivated shoppers.
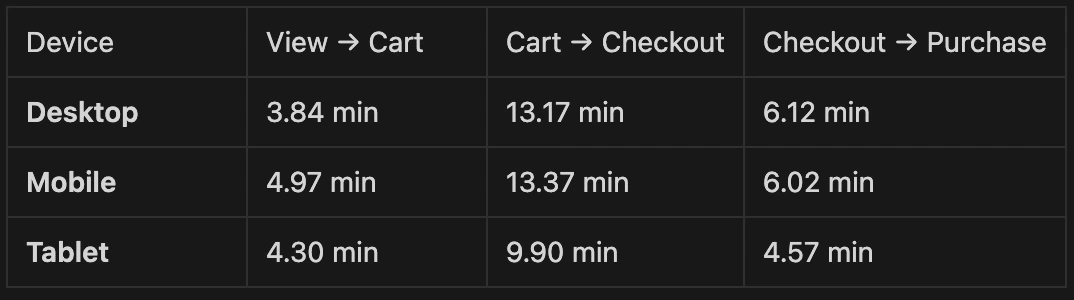
⏱️ Key Results: Time to Convert (Average per Step)
📌 Insights
Users typically add to cart within 4–5 minutes of viewing an item, indicating fast decision-making.
Cart to checkout time averages around 13 minutes, suggesting minor hesitation or distraction, ideal for nudge campaigns or UX improvements.
Checkout to purchase average under 7 minutes, which is a healthy signal of payment process efficiency.
Tablet users complete the funnel faster overall, supporting the idea of more focused browsing behavior.
🔍 Summary Business Insights
Biggest Drop-Off: The most critical point is the transition from product view to add-to-cart; this is the key optimization target.
Conversion Strength: Once users are in checkout, more than half complete the purchase, indicating the checkout process itself is effective.
Fast Flow: Most conversions occur within a short time window, ideal for same-session marketing and real-time personalization.
Mobile & Tablet Strengths: Mobile has high volume and solid conversion, while tablet users convert at the highest rate—both should be prioritized in UX strategy.
✅ Strategic Recommendations
Improve product detail clarity and CTA placement to increase the Add-to-Cart rate
Consider triggering cart nudges or discount timers around the 10–15 minute mark
Run mobile A/B tests to fine-tune the high-performing funnel
Retarget high-intent users who stall between cart and checkout
Segment campaign audiences by device behavior to align with funnel tendencies
🛠️ Tools & Techniques
BigQuery • GA4 • SQL (Window Functions) • Funnel Analysis • Device Segmentation • Conversion Timing Metrics
Like this project
Posted Apr 18, 2025
Conducted funnel analysis using GA4 and BigQuery to improve conversion rates.
Likes
0
Views
13