Air Pollution & Sociodemographic Impact on COVID-19 Outcomes
Chaya Chaipitakporn
🧪 Air Pollution & Sociodemographic Impact on COVID-19 Outcomes in the U.S.
📌 Project Type: Academic Research – Forecasting & Risk Segmentation
📍 Published in: Frontiers in Epidemiology
👨🔬 Role: Co-Author – ARIMA Forecasting, Data Cleaning & Visualization
🧩 Project Summary
This nationwide study investigated how sociodemographic and environmental factors impacted COVID-19 infections and fatalities across large U.S. counties during the pre-vaccination phase (Jan–Dec 2020).
It revealed that the effect of risk factors like education, pollution, and poverty changed over time, and were often only significant in high-infection zones, highlighting the importance of dynamic, region-based health strategies.
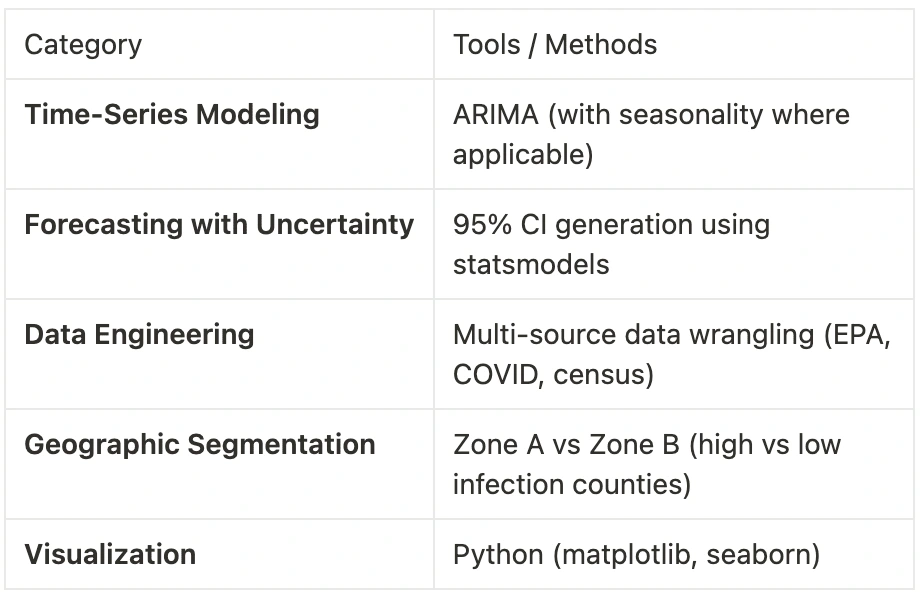
🧪 My Technical Contributions
✅ Time-Series Forecasting with ARIMA
Built ARIMA models to predict pollution levels (PM2.5, NO₂, SO₂, O₃) over time
Generated 95% confidence intervals to visualize uncertainty across different regions
Created zone-specific forecasts aligned with the COVID-19 wave timeline (Phases 1 & 2)
✅ Data Cleaning & Structuring
Processed and merged large-scale public datasets (EPA air quality, population, COVID-19 rates)
Structured time-series data by pollutant and county; ensured temporal alignment
Resolved missing or inconsistent values across thousands of time points
✅ Scientific Visualization
Created time-series plots with confidence bands for inclusion in published figures
Visualized regional trends across infection zones for insight into environmental shifts
🔧 Techniques Used
🔍 Key Insights from the Study
Phase 1: Population density, poverty, and education were stronger predictors
Phase 2: Those same variables lost significance, while age and O₃ exposure became more important
NO₂ correlated with fatality only in high-infection zones
Forecasting helped visualize pollution recovery and spikes in high-activity areas
✅ Relevance to Freelance / Consulting Work
This project proves my ability to:
Build forecasting models using Python and real-world environmental data
Segment and compare trends across geographies and time periods
Visualize uncertainty for decision support or policy design
Handle large, messy public datasets with scientific rigor
Applicable to:
Demand forecasting, trend monitoring, retention prediction, sustainability analytics
🛠️ Tools & Skills Demonstrated
Python • pandas • statsmodels (ARIMA) • data wrangling • scientific visualization • public health data • multi-source dataset integration
Like this project
Posted Apr 18, 2025
Study on sociodemographic and environmental impacts on COVID-19 in U.S. counties.
Likes
0
Views
2