Juice Market Research

Divine Osemeke


Overview
This project focused on conducting market research for a juice company to understand customer preferences, spending patterns, and top customers.
The analysis aimed to provide insights into monthly spending by occupation, monthly spending by country, preferred juice flavors, and the top 10 customers.
Problem Statement
The juice company needed to identify key trends in customer behavior to optimize marketing strategies and product offerings.
The analysis focused on understanding how different occupations and countries contribute to monthly spending, which juice flavors are most preferred, and who the top 10 customers are. Process The project followed a structured data analysis
Process
1. Data Understanding: Gaining a comprehensive understanding of the data sources, structure, and content.
2. Data Cleaning: Ensuring data quality by removing duplicates, handling missing values, and standardizing formats.
3. Data Modeling: Developing models to categorize and analyze the data effectively.
4. Data Analysis: Applying statistical and machine learning techniques to uncover patterns and trends.
5. Uncover Insights: Interpreting the analysis results to derive actionable insights.
Insights
The analysis revealed significant insights into customer behavior and preferences:
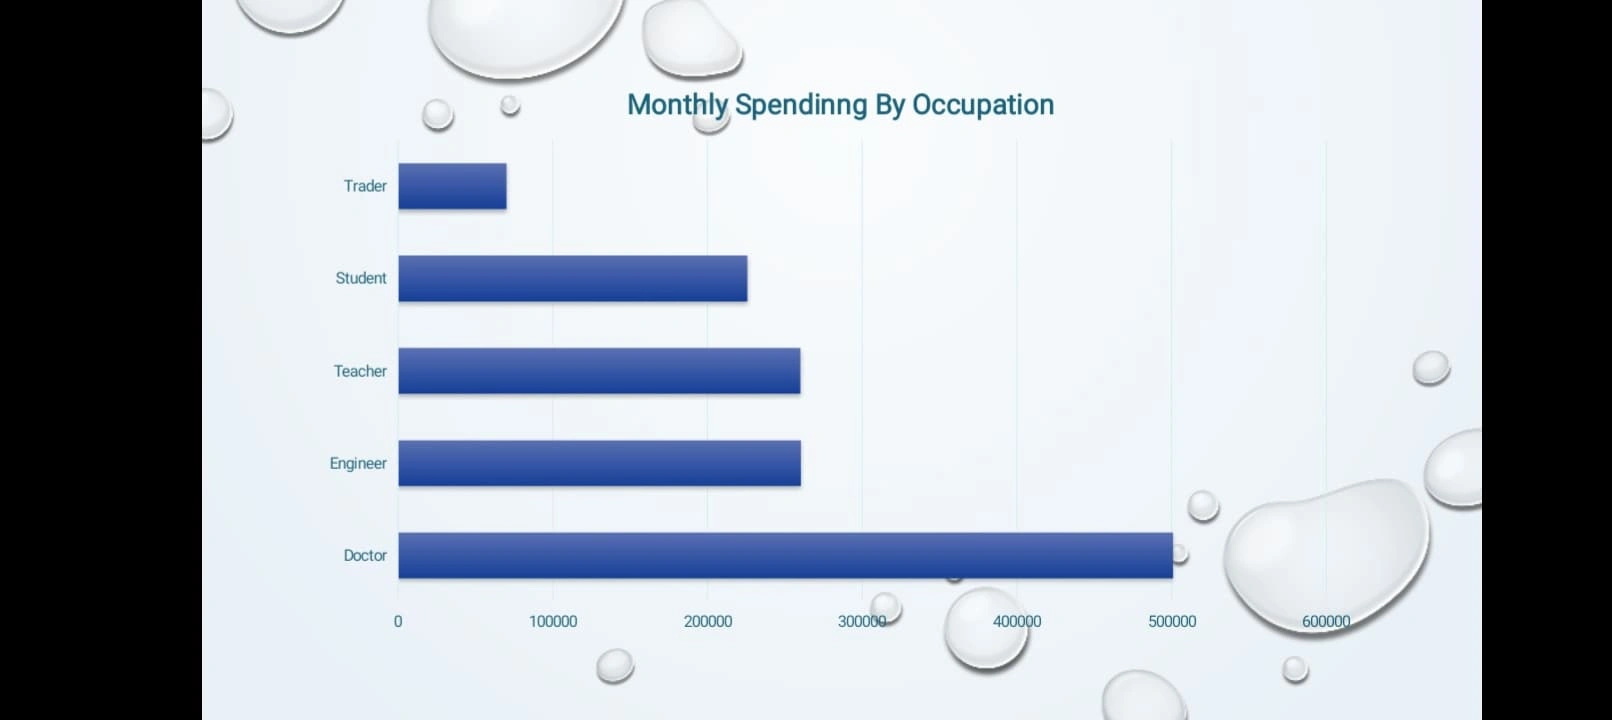
Monthly Spending by Occupation:
Traders had the lowest monthly spending, followed by students, teachers, engineers, and doctors.
Monthly Spending by Country:
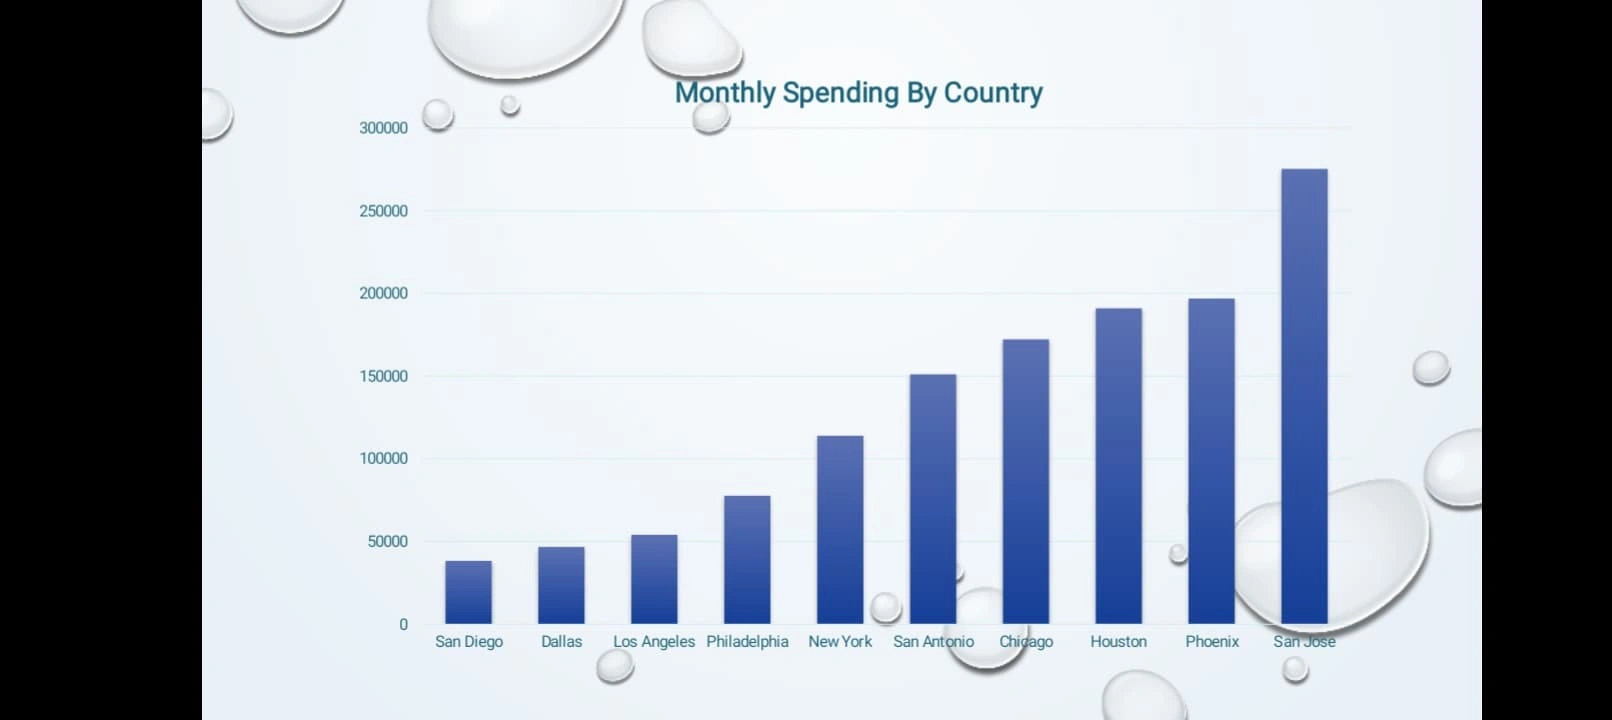
San Diego had the lowest monthly spending, followed by Dallas, Los Angeles, Philadelphia, New York, San Antonio, Chicago, Houston, Phoenix, and San Jose.
Flavor Preference:

Strawberry was the most preferred flavor at 42%, followed by grape at 33% and apple at 25%.
Top 10 Customers:
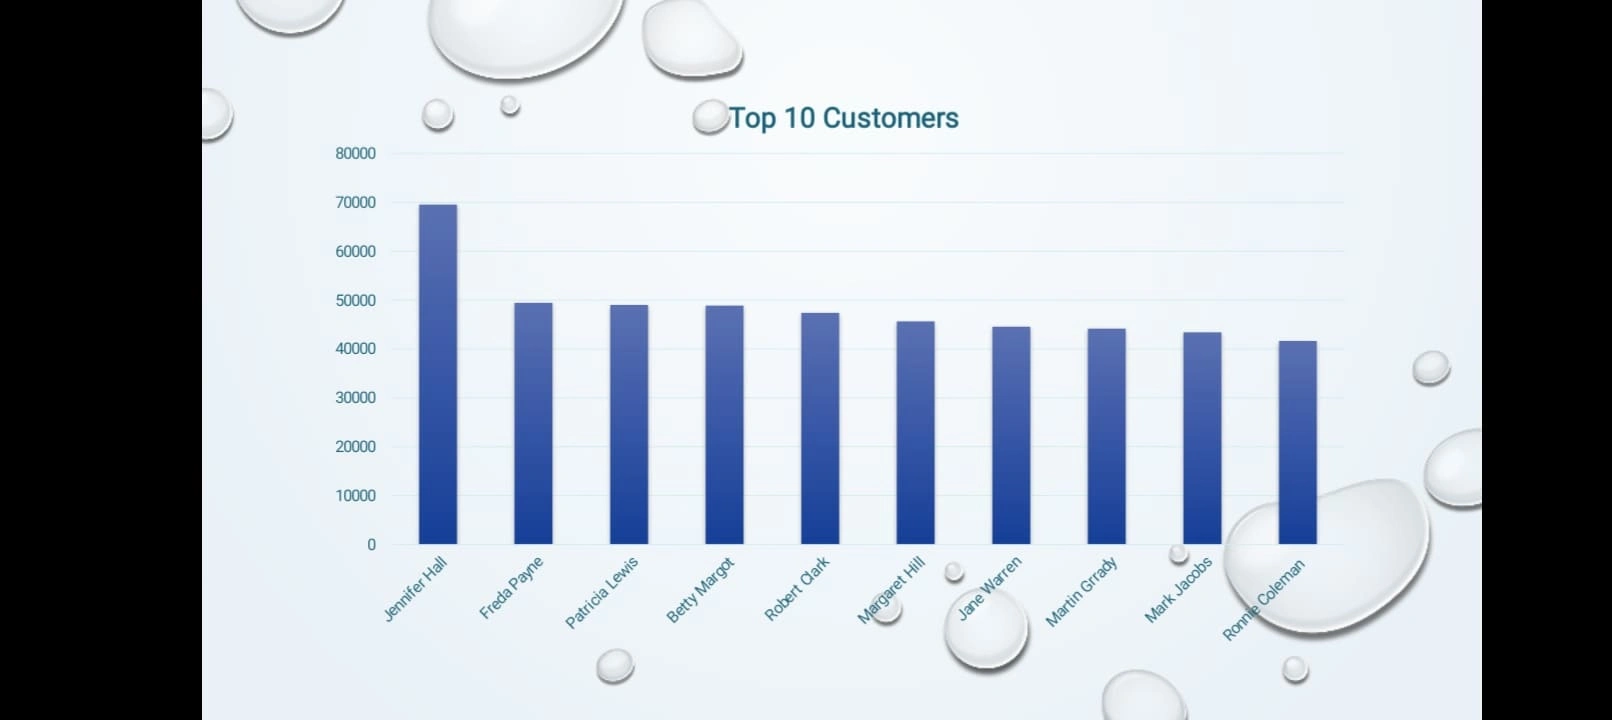
The top 10 customers were identified based on their spending, with Jennifer Hall being the highest spender, followed by Freda Payne, Patricia Lewis, Betty Margot, Robert Clark, Margaret Hill, Jane Warren, Martin Grrady, Mark Jacobs, and Ronnie Coleman.
Summary
The analysis highlighted that traders and residents of San Diego are the highest spenders, while strawberry is the most preferred juice flavor.
The top 10 customers contribute significantly to the company's revenue and should be targeted for loyalty programs and personalized marketing.
The next steps include optimizing marketing strategies to target high-spending occupations and regions, introducing new products or variations based on flavor preferences, and implementing loyalty programs for the top 10 customers to ensure continued engagement and revenue growth.
Like this project
Posted Feb 11, 2025
This project focused on conducting market research for a juice company to understand customer preferences, spending patterns, and top customers.


Online Retail Store Data Analysis

Social Buzz Data Analysis