Online Retail Store Data Analysis

Divine Osemeke


Overview
An online retail store required assistance in providing valuable insights to the CEO and CMO.
The analysis focused on three key tasks:
Analyzing revenue by month for the most recent year.
Identifying the countries bringing in the most revenue.
Finding the top 10 customers.
The goal was to capitalize on the vast amount of data generated by over 78 countries and 4,906,888 items sold.
Problem Statement
The primary challenge was the overwhelming volume of data, with purchases from over 78 countries and nearly 5 million items sold.
The analysis aimed to identify revenue trends by month, determine the top revenue-generating countries, and pinpoint the top 10 customers to inform strategic decisions.
Process
The project followed a structured data analysis process:
1. Data Understanding: Gaining a comprehensive understanding of the data sources, structure, and content.
2. Data Cleaning: Ensuring data quality by removing duplicates, handling missing values, and standardizing formats.
3. Data Modeling: Developing models to categorize and analyze the data effectively.
4. Data Analysis: Applying statistical and machine learning techniques to uncover patterns and trends.
5. Uncover Insights: Interpreting the analysis results to derive actionable insights.
Insights
The analysis revealed significant insights into revenue trends, top-performing countries, and customer engagement:
Revenue by Month:
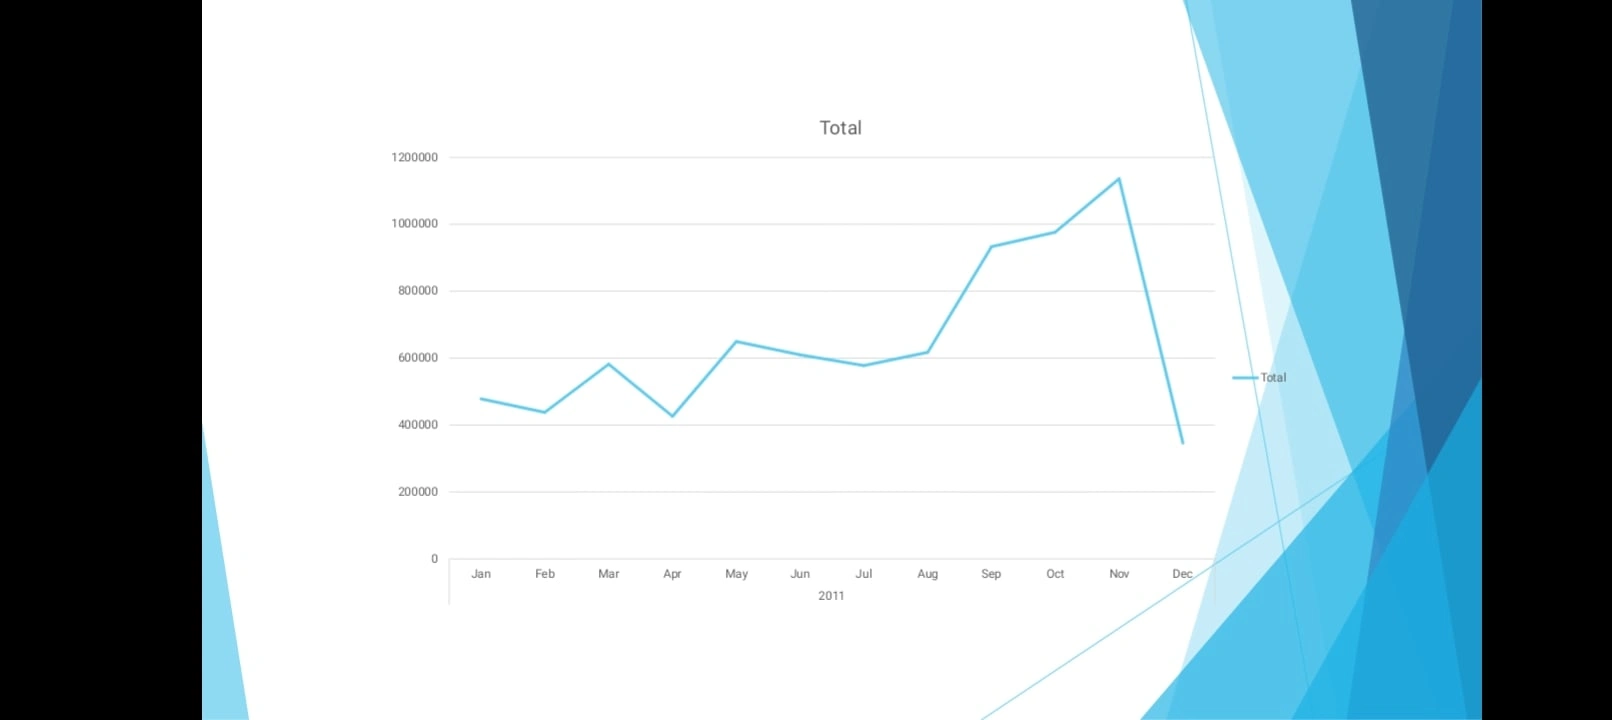
Sales peaked in November, October, and September, with December performing the worst. November showed a 1296.34% increase in revenue compared to other months.
Top Countries:
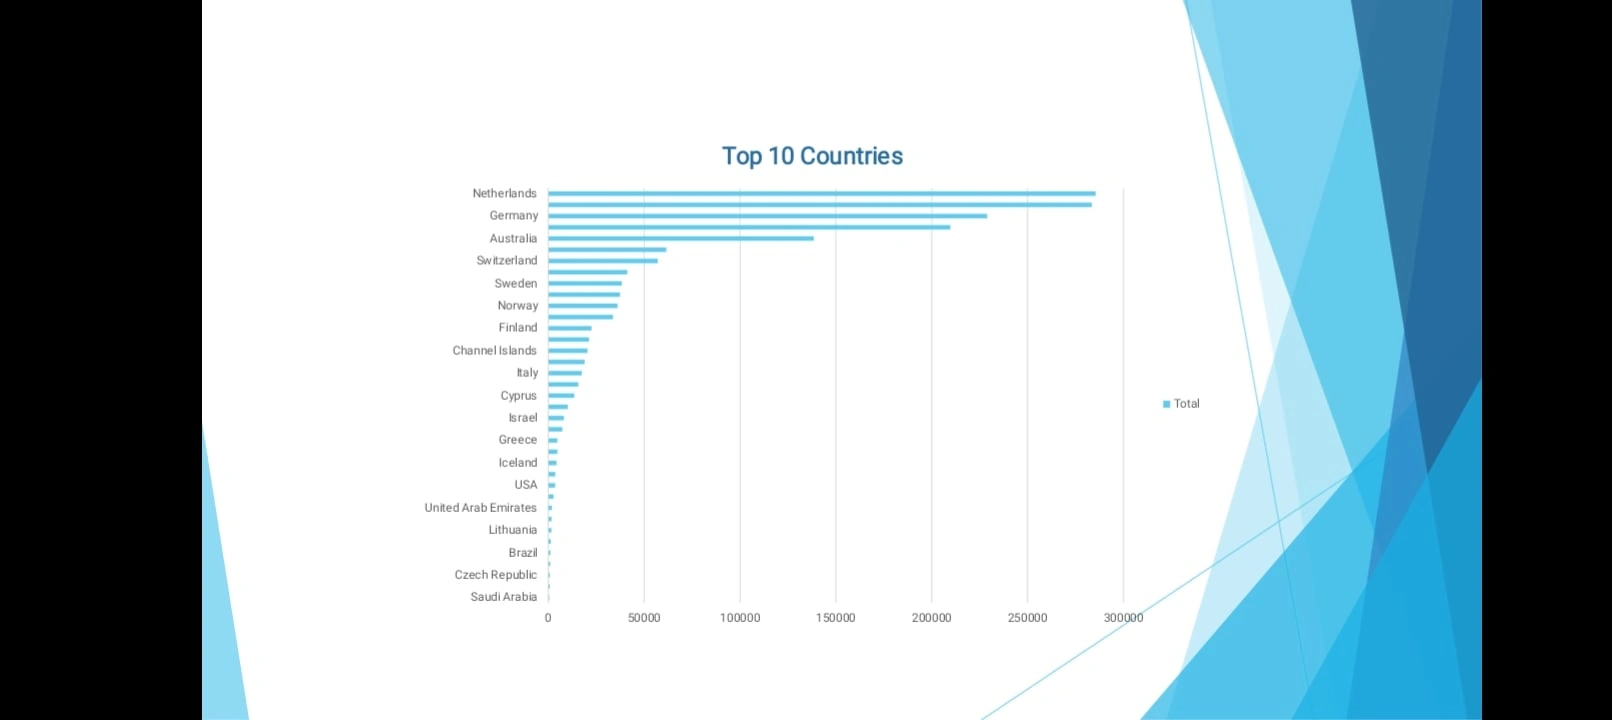
Tohe Netherlands led in revenue generation, followed by EIRE, Germany, and France. Europe dominated the revenue share, with the Netherlands being the top performer.
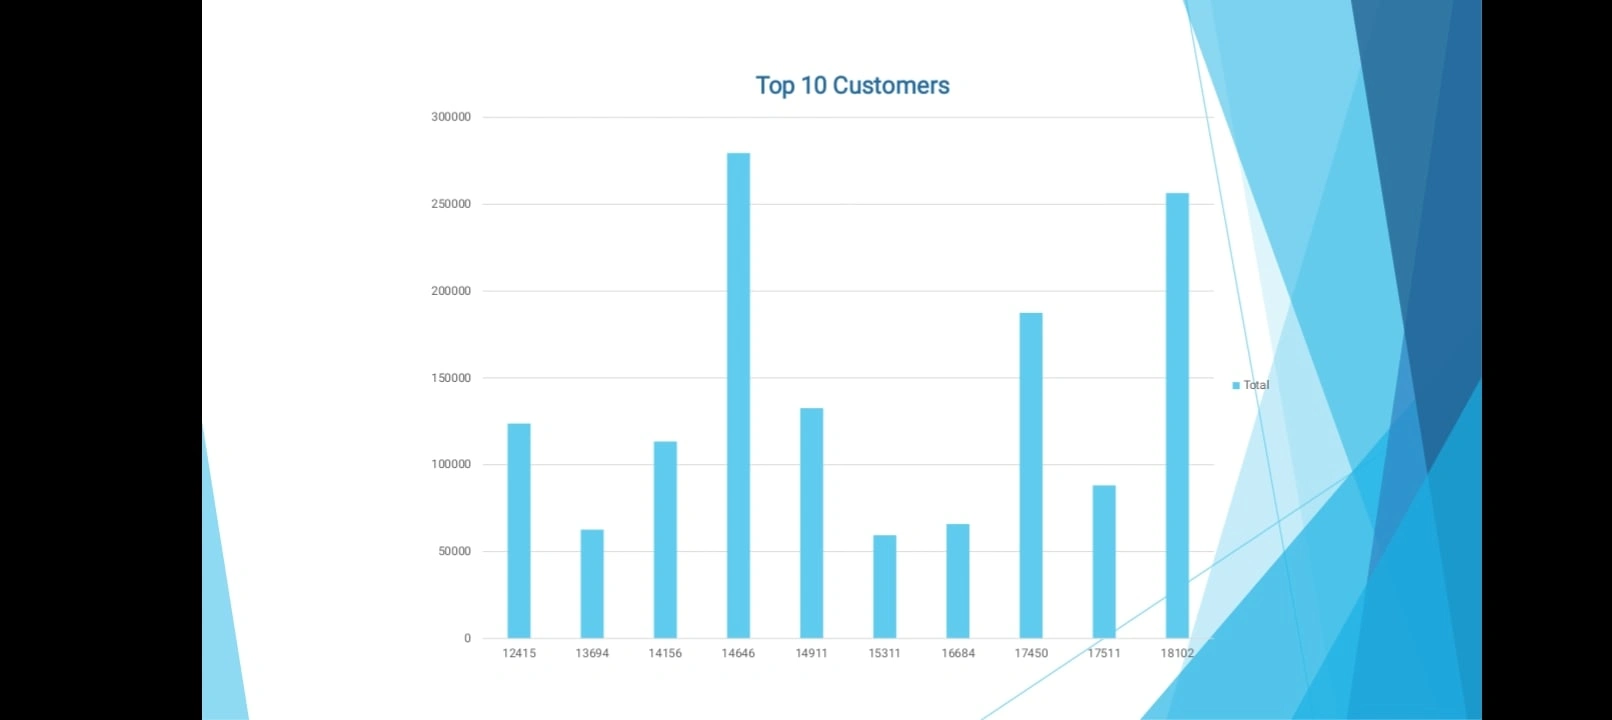
Top 10 Customers:
The analysis identified the top 10 customers based on their engagement and purchase patterns. These customers contributed significantly to the overall revenue.
Summary
The analysis highlighted strong Q4 sales, with November being the highest revenue-generating month. However, December's performance was notably poor and requires further investigation. Europe, led by the Netherlands, was the dominant region in terms of revenue.
The massive growth in 2011 suggests that key drivers of this growth should be identified and leveraged for future strategies.
The next steps include investigating the reasons behind December's low sales, analyzing the factors contributing to the massive growth in 2011, expanding in top-performing markets, and optimizing seasonal strategies to maximize revenue.
These steps will help the online retail store capitalize on its data and drive sustained growth.
Like this project
Posted Feb 11, 2025
This project analyzed sales data from an online retail store to provide actionable insights for the CEO and CMO.


Social Buzz Data Analysis

Juice Market Research