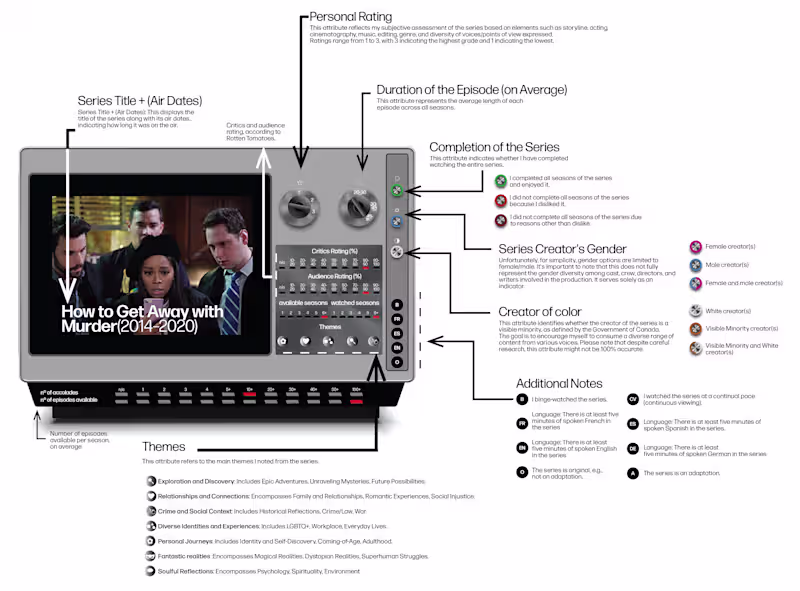


What should I look for in a freelance data visualizer's portfolio?
A good portfolio shows a range of work. Look for creativity and how well they tell a story with data. Check if they use different tools and styles. See if their work matches what you need for your project.
How can I communicate my project needs clearly to a data visualizer?
Start by writing down your goals and what you want to see. Use simple language. Share any examples you have. A clear project brief helps the freelancer understand your vision.
Why are deliverables important when hiring a data visualizer?
Deliverables are what you get at the end of the project. They help both you and the freelancer know what to expect. Agreeing on deliverables makes sure the final work meets your needs. It's like having a checklist for the project.
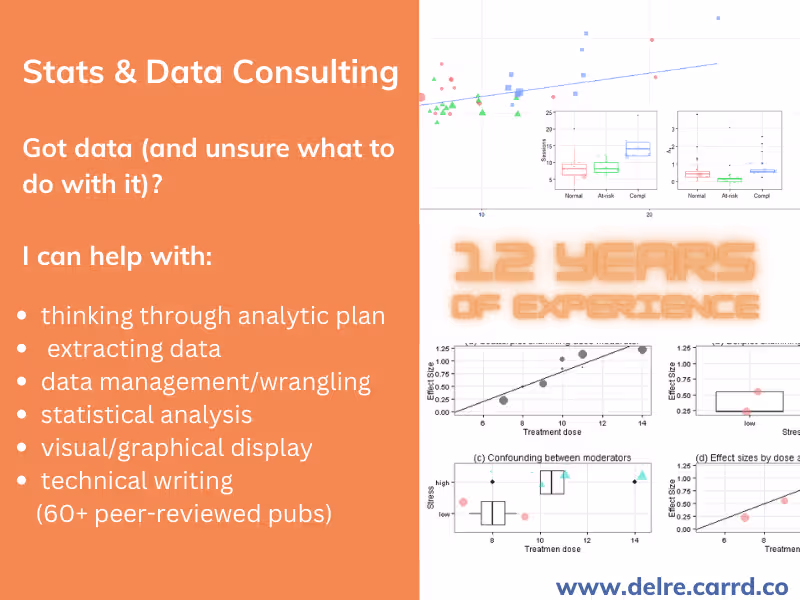
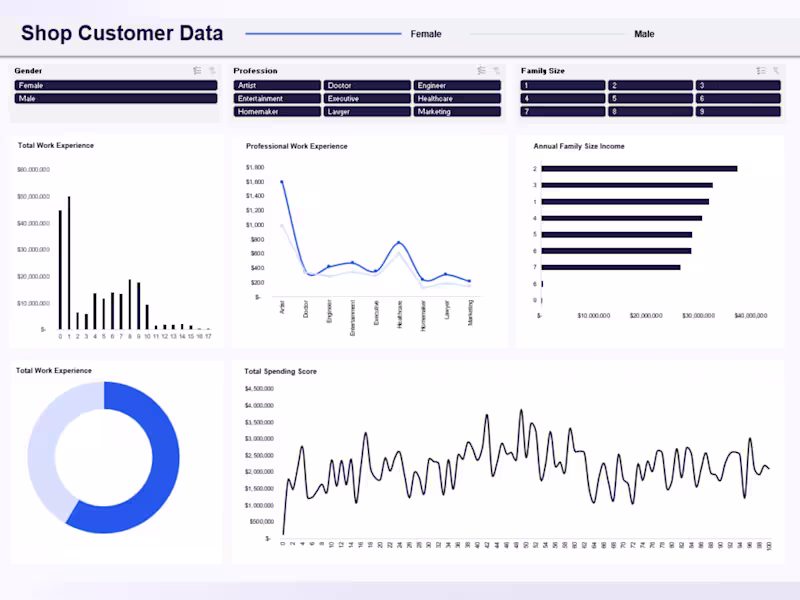
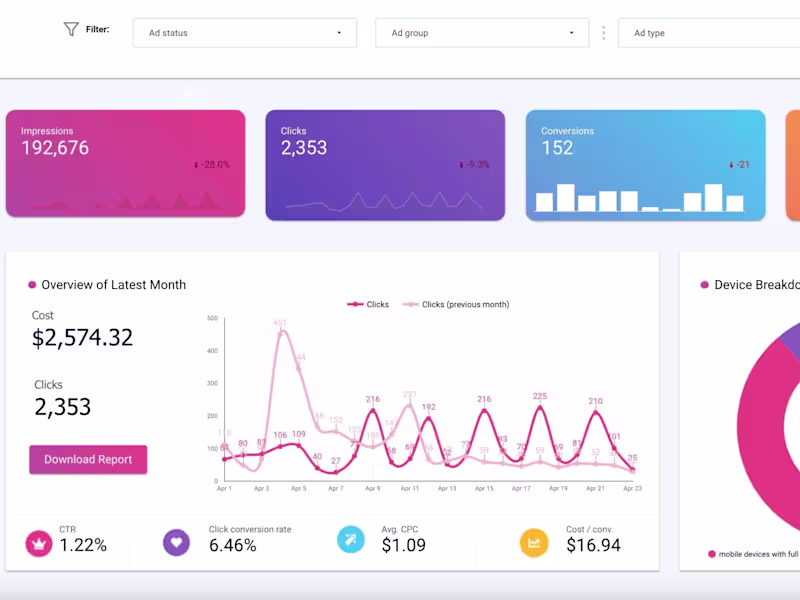
What tools should a data visualizer be familiar with?
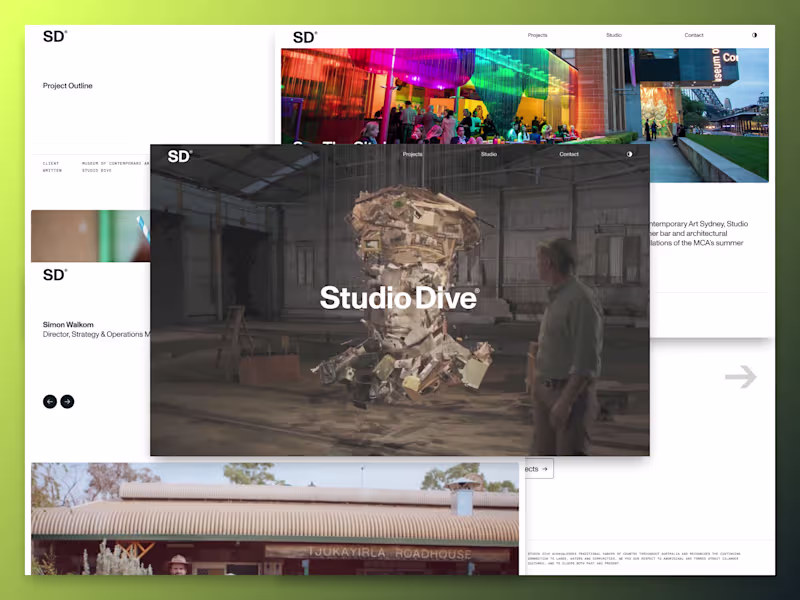
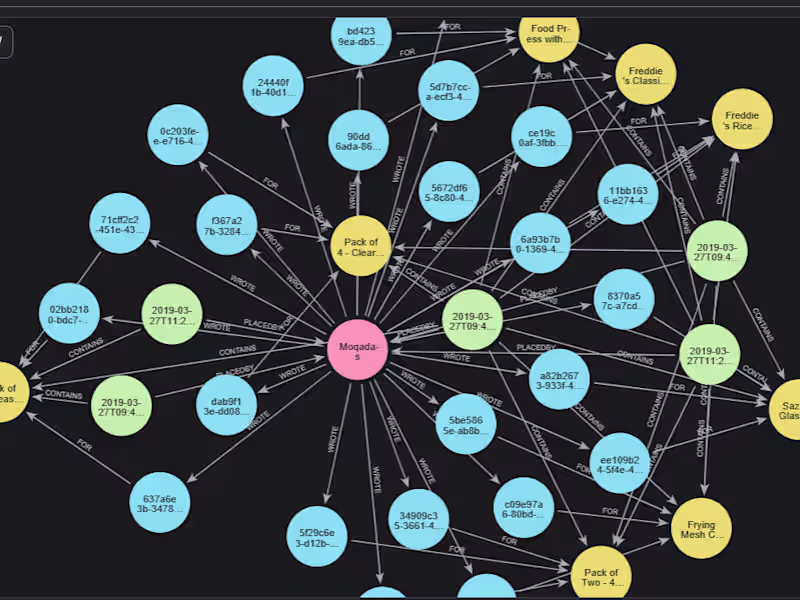
Data visualizers use many tools to create their work. Common ones are Tableau, Power BI, and D3.js. Ask if they know how to use specific tools you prefer. The right tools help them make charts and graphs that look great.
How important is it for a data visualizer to understand my industry?
Understanding your industry can be helpful. It means they know the kind of data you work with. They might understand trends and what matters most. This helps them make visuals that are meaningful and accurate.
What should I include in the project timeline for a data visualization project?
A good timeline includes start and end dates. Break it down into smaller parts like research, design, and review phases. This helps keep the project on track. Both you and the data visualizer should agree on the timeline.
How can I ensure the data visualizer captures my brand's style?
Show them your brand guide or examples of past work. Talk about colors, fonts, and styles you like. Ask for a small sample early on to see if it matches your brand. This helps make sure everything looks the way you want.
What is the best way to give feedback to a data visualizer?
Be honest and clear with your feedback. Point out what you like and what needs fixing. Use screenshots or specific examples. Regular check-ins can help solve issues before they become big problems.
How do I know if the project is progressing as planned?
Set up regular status updates. These can be weekly check-ins or emails. Ask the data visualizer to show what they’ve done so far. Clear communication helps keep everything on track.
Why should I care about the data visualizer's revision policy?
Revisions are important for getting the final product right. Knowing their policy helps you understand how many changes can be made. This ensures you’re happy with the final visuals. It's important for planning and budget too.
Who is Contra for?
Contra is designed for both freelancers (referred to as "independents") and clients. Freelancers can showcase their work, connect with clients, and manage projects commission-free. Clients can discover and hire top freelance talent for their projects.
What is the vision of Contra?
Contra aims to revolutionize the world of work by providing an all-in-one platform that empowers freelancers and clients to connect and collaborate seamlessly, eliminating traditional barriers and commission fees.


![Cover image for [Case Studies] How I helped startups with product growth](https://media.contra.com/image/upload/q_auto,w_800/uxiibfbxkk1up1hgpv6k.avif)