I designed this specialized dashboard

Sumit Tambitkar

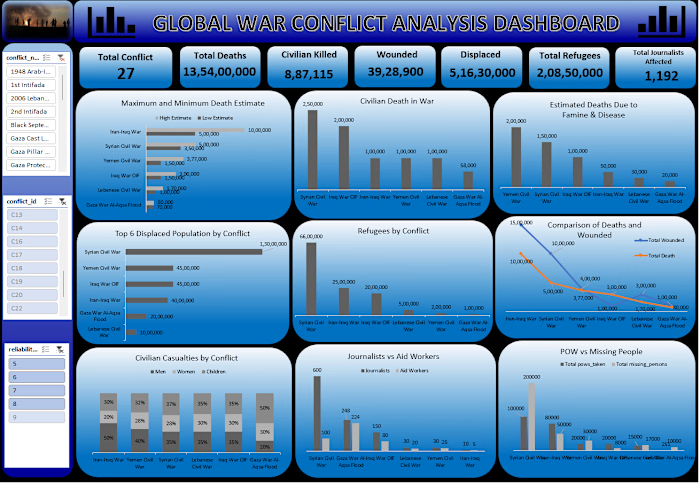
I designed this specialized dashboard to analyze how global geopolitical conflicts and wars directly impact crude oil prices, stock markets, and GDP growth. The goal was to take a highly complex global dataset and turn it into clear, visual trends.
Here is how I worked on this analytical project:
Data Prep & Sorting: Filtered and cleaned a huge raw dataset in Excel, fixing timeline gaps and aligning historical oil price variations properly.
Tracking Global Metrics: Tracked critical high-level data points, such as crude oil peak prices ($130.33), volatility rates (56.22%), and the exact number of war incidents (52).
Analytical Visualizations: Built dynamic trend lines showing monthly and daily crude oil fluctuations, bar charts for sector-wise impacts, and stock market response graphs.
I chose a dark theme with bright teal indicators to give it a modern data terminal look. The dashboard is fully interactive, letting you check the specific impact of different conflict phases instantly.
Tools used: Microsoft Excel (Data Cleaning, Advanced Analytics, Pivot Charts, Dashboard Architecture)
Like this project
Posted Aug 19, 2026
I designed this specialized dashboard to analyze how global geopolitical conflicts and wars directly impact crude oil prices, stock markets, and GDP growth. ...
Likes
0
Views
0