Intentional Chart Design 📊 This chart compares 2025 monthly...
Sidra choudry
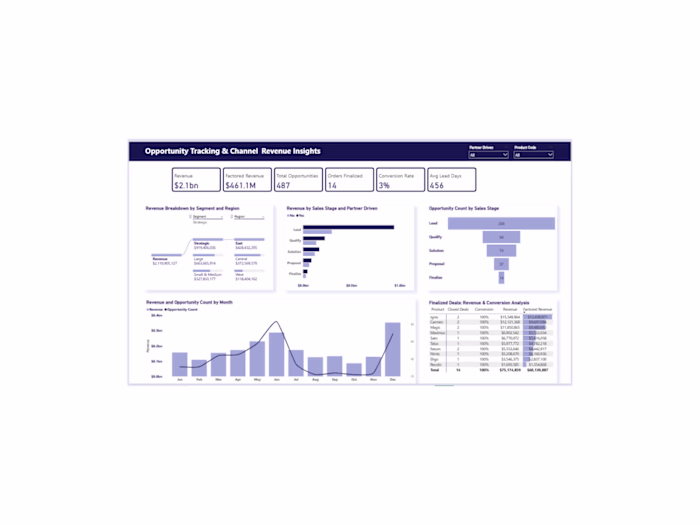
Intentional Chart Design 📊
This chart compares 2025 monthly revenue with 2024 performance to answer one question:
👉 Are we growing year over year?
• Bars = current year clarity
• Line = quick YoY context
• Clean layout = faster decisions
I design Power BI visuals to be simple, intentional, and business-focused.
Open to Power BI contract work.
Like this project
Posted Dec 23, 2025
Intentional Chart Design 📊 This chart compares 2025 monthly revenue with 2024 performance to answer one question: 👉 Are we growing year over year? • Bars =...
Likes
0
Views
3