Mobile Sales Analytics Dashboard
Sidra choudry
Mobile Sales Analytics Dashboard
Description:
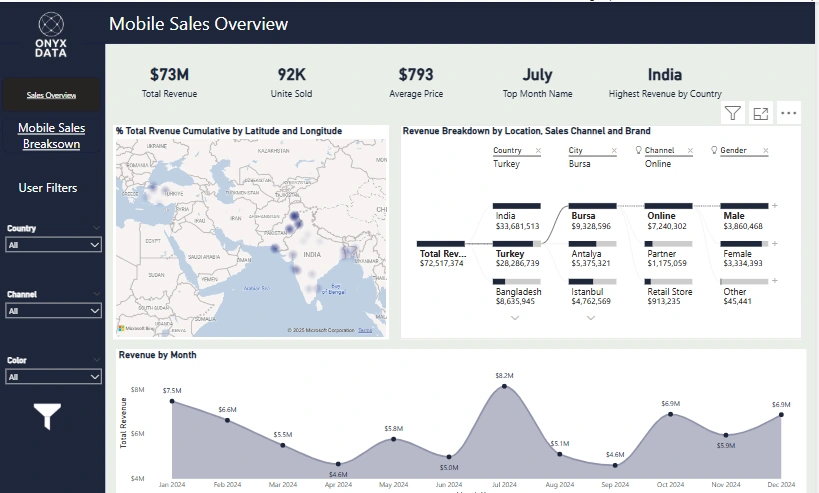
I built an interactive Power BI dashboard for analyzing mobile phone sales data across geographies, channels, and customer demographics to derive actionable business insights.
Key skills used:
Data Cleaning, Data Modeling, DAX, Data Visualization.
Details on skills applied:
This project was built using a semi-structured dataset from Onyx Data of Mobile Sales 2024. The dataset included a flat sales table, along with
Dim_Product Dim_Location tables. However, it didn’t include a proper Date table or Customer table, which meant I had to handle data modeling from the ground up.I started by loading the data into Power Query and doing some exploratory analysis to get a sense of the structure and spot any issues. From there, I cleaned and transformed the data directly in Power BI to make it usable for reporting.
Since key dimensions were missing, I created a custom Date table and Customer table to set up a proper star schema by linking the fact and dimension tables through physical relationships. This structure made it possible to write reliable DAX measures and use time-based functions for insights like monthly trends, running totals, and cumulative revenue.
Everything I built, from data modeling and DAX calculations to visuals, was designed to answer real stakeholder questions, such as:
Which phone models are top performers?
Which countries and sales channels drive the most revenue?
What sales trends emerge over time?
For the first time in my journey, I used a Pareto Chart to apply the 80/20 rule and discovered that just 7 mobile models contribute over 70% of total sales. This insight confirmed that a small portion of the product lineup delivers most business value. As a result, stakeholders could prioritize inventory, marketing, and distribution strategies around these top performers and reallocate resources from low-impact models.
The problem:
Stakeholders needed a clear understanding of which mobile products, regions, and sales channels were driving revenue to optimize inventory, marketing, and sales strategies.
My insights:
Only 7 mobile models accounted for over 70% of total revenue.
A Pareto Chart revealed that the top 20% of brands generated 80% of revenue.
Certain countries consistently outperformed others, despite similar customer counts.
Online channels showed higher average order values than physical stores.
Sales peaked in Q3, suggesting seasonal demand patterns.
My recommendations:
Focus marketing and stock on high-performing models to maximize ROI.
Reallocate resources away from underperforming models.
Increase promotion in top-performing regions and optimize logistics.
Boost investment in online channels to capitalize on higher order values.
Plan seasonal campaigns around Q3 to match peak buying behavior.
Github Repository Link :

Mobile Sales Breakdown
Like this project
Posted May 28, 2025
Built a Power BI dashboard for mobile sales analysis, revealing key insights for strategic decisions.
Likes
1
Views
7
Timeline
May 1, 2025 - May 24, 2025
Clients
Onyx Data