
🛒 E-commerce & Financial Dashboard | Power BI | $2.34M Revenue
Built an end-to-end E-commerce analytics dashboard to track sales, profit & inventory.
🔹 Problem: Client had no visibility on which products/channels are profitable
🔹 Solution: Built automated dashboard with live inventory alerts
Features Built:
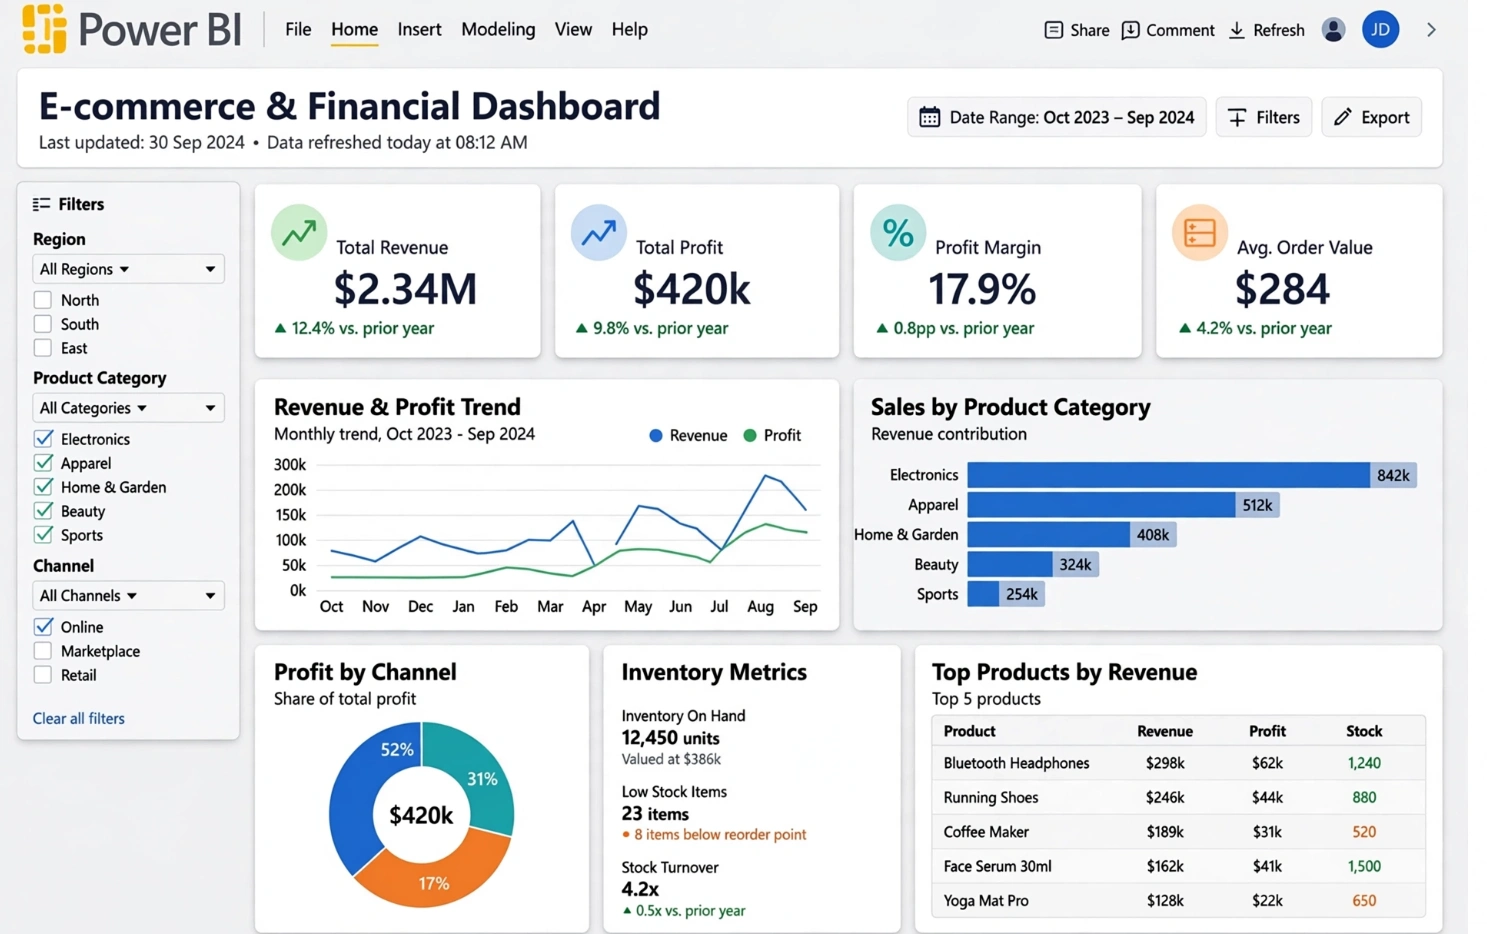
✓ Total Revenue $2.34M (+12.4% YoY), Profit $420K, Margin 17.9%
✓ Revenue & Profit Trend (Oct 2023 - Sep 2024)
✓ Sales by Product Category - Electronics $842K top
✓ Profit by Channel - Online 52% share
✓ Inventory Metrics: 12,450 units, Low stock alert (23 items), Stock Turnover 4.2x
✓ Top 5 Products table with Stock levels
Tools Used: Power BI, DAX, Power Query, Excel, Inventory Management
Result: Client identified best-selling products and reduced out-of-stock by 35%. Automated daily refresh at 06:00 UTC.
This dashboard is used by the Founder daily to take decisions.
0 likes · 0 views · Oct 2, 2026
🛒 E-commerce & Financial Dashboard | Power BI | $2.34M Revenue Built an end-to-end E-commerce analytics dashboard to track sales, profit & inventory. 🔹 Pro...


