
📊 Sales KPI Dashboard - Power BI | $4.82M Revenue Tracking
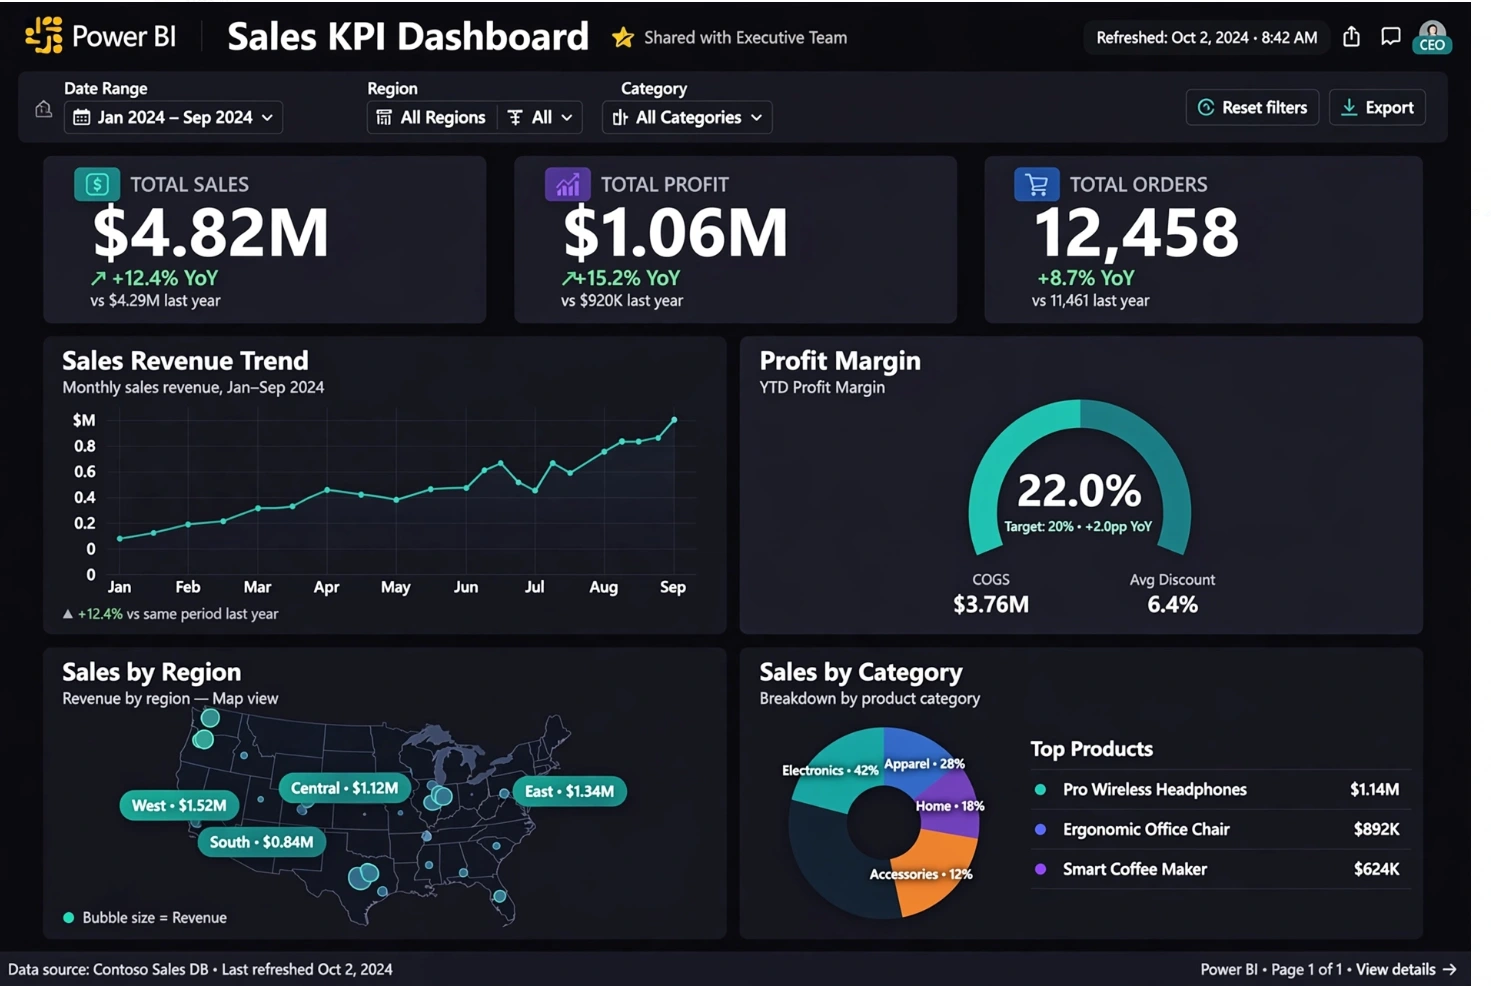
Built a CEO-level Sales KPI Dashboard to automate manual Excel reporting.
🔹 Problem: Client was spending 8+ hours weekly on Excel reports
🔹 Solution: Built automated Power BI dashboard with DAX measures
Features Built:
✓ Total Sales, Profit, Orders KPIs with YoY growth
✓ Sales Revenue Trend (Monthly)
✓ Sales by Region - Interactive US Map
✓ Sales by Category & Top Products breakdown
✓ 22% Profit Margin tracking
Tools Used: Power BI, Excel, DAX, Power Query
Result: Reduced reporting time from 8 hours to 10 mins. CEO can now take decisions in real-time.
Live Dashboard: Fully interactive with filters by Date, Region, Category
0 likes · 0 views · Oct 2, 2026
📊 Sales KPI Dashboard - Power BI | $4.82M Revenue Tracking Built a CEO-level Sales KPI Dashboard to automate manual Excel reporting. 🔹 Problem: Client was ...

