Built with Framer

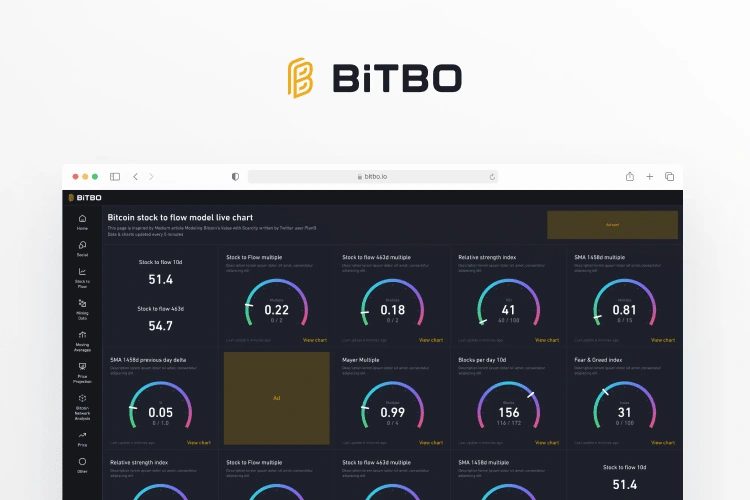
Project Overview
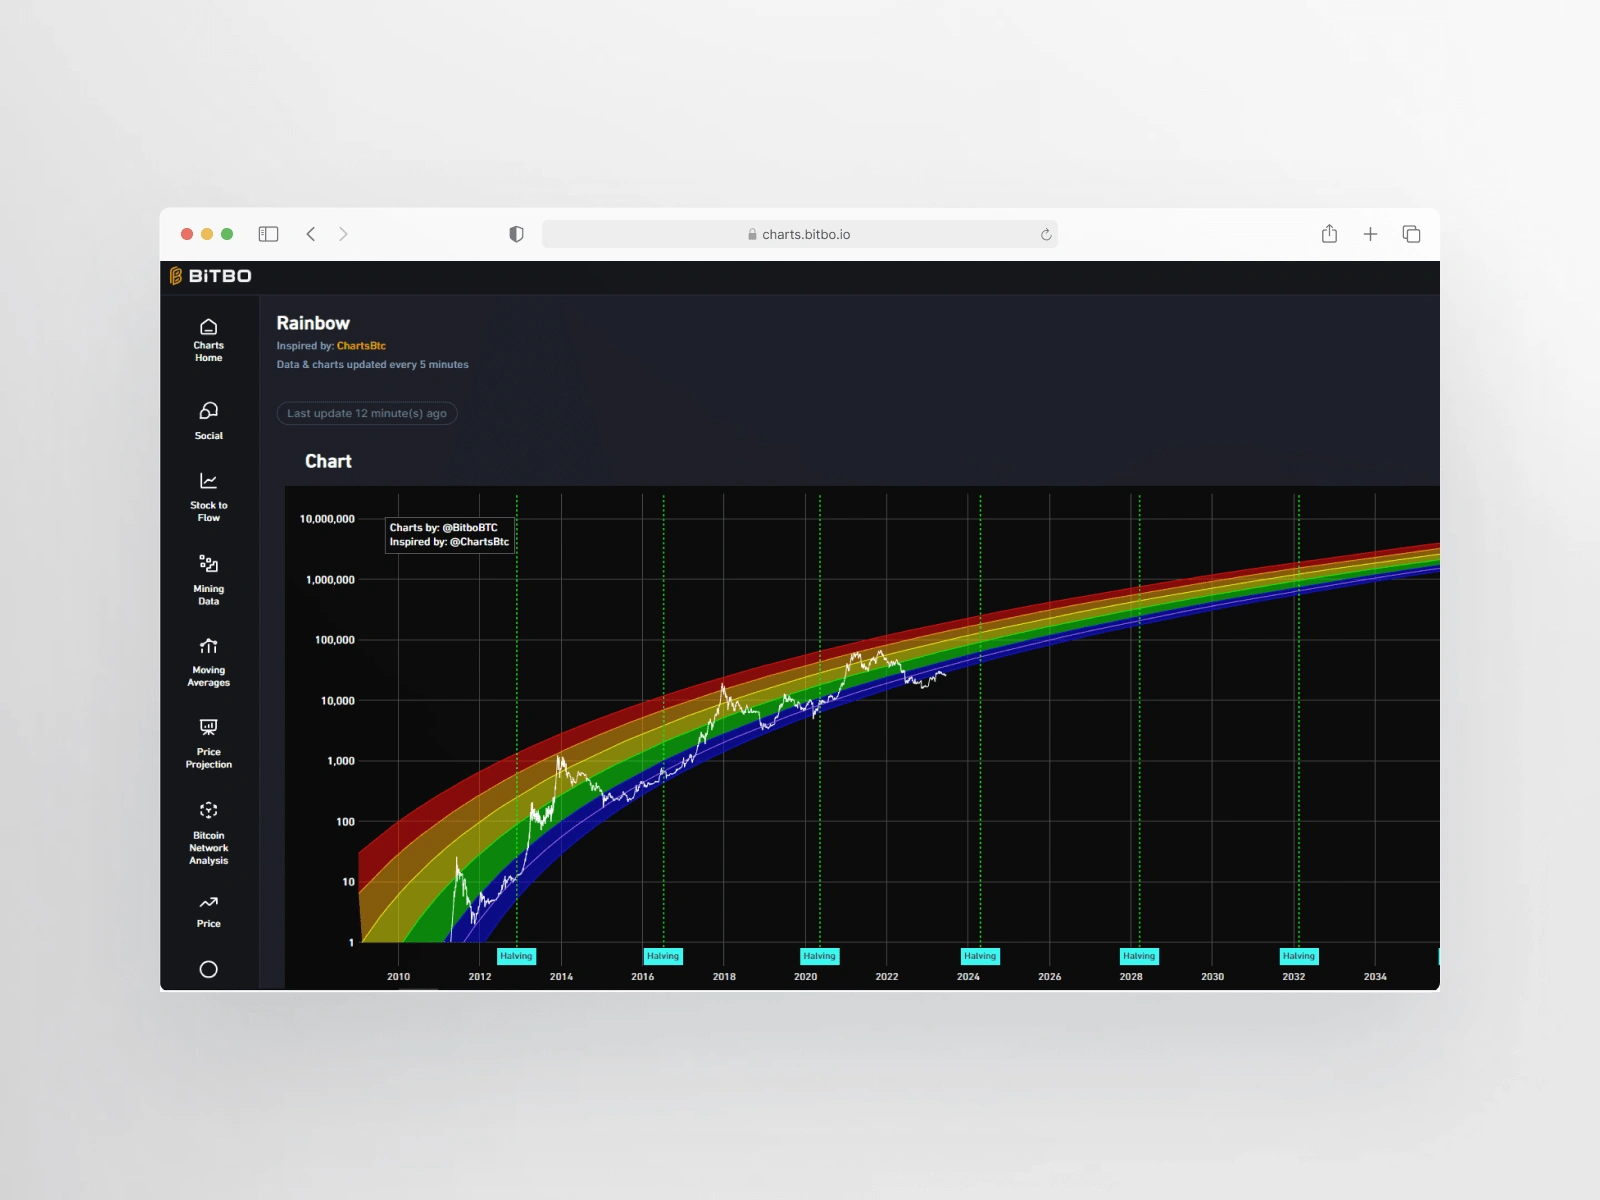
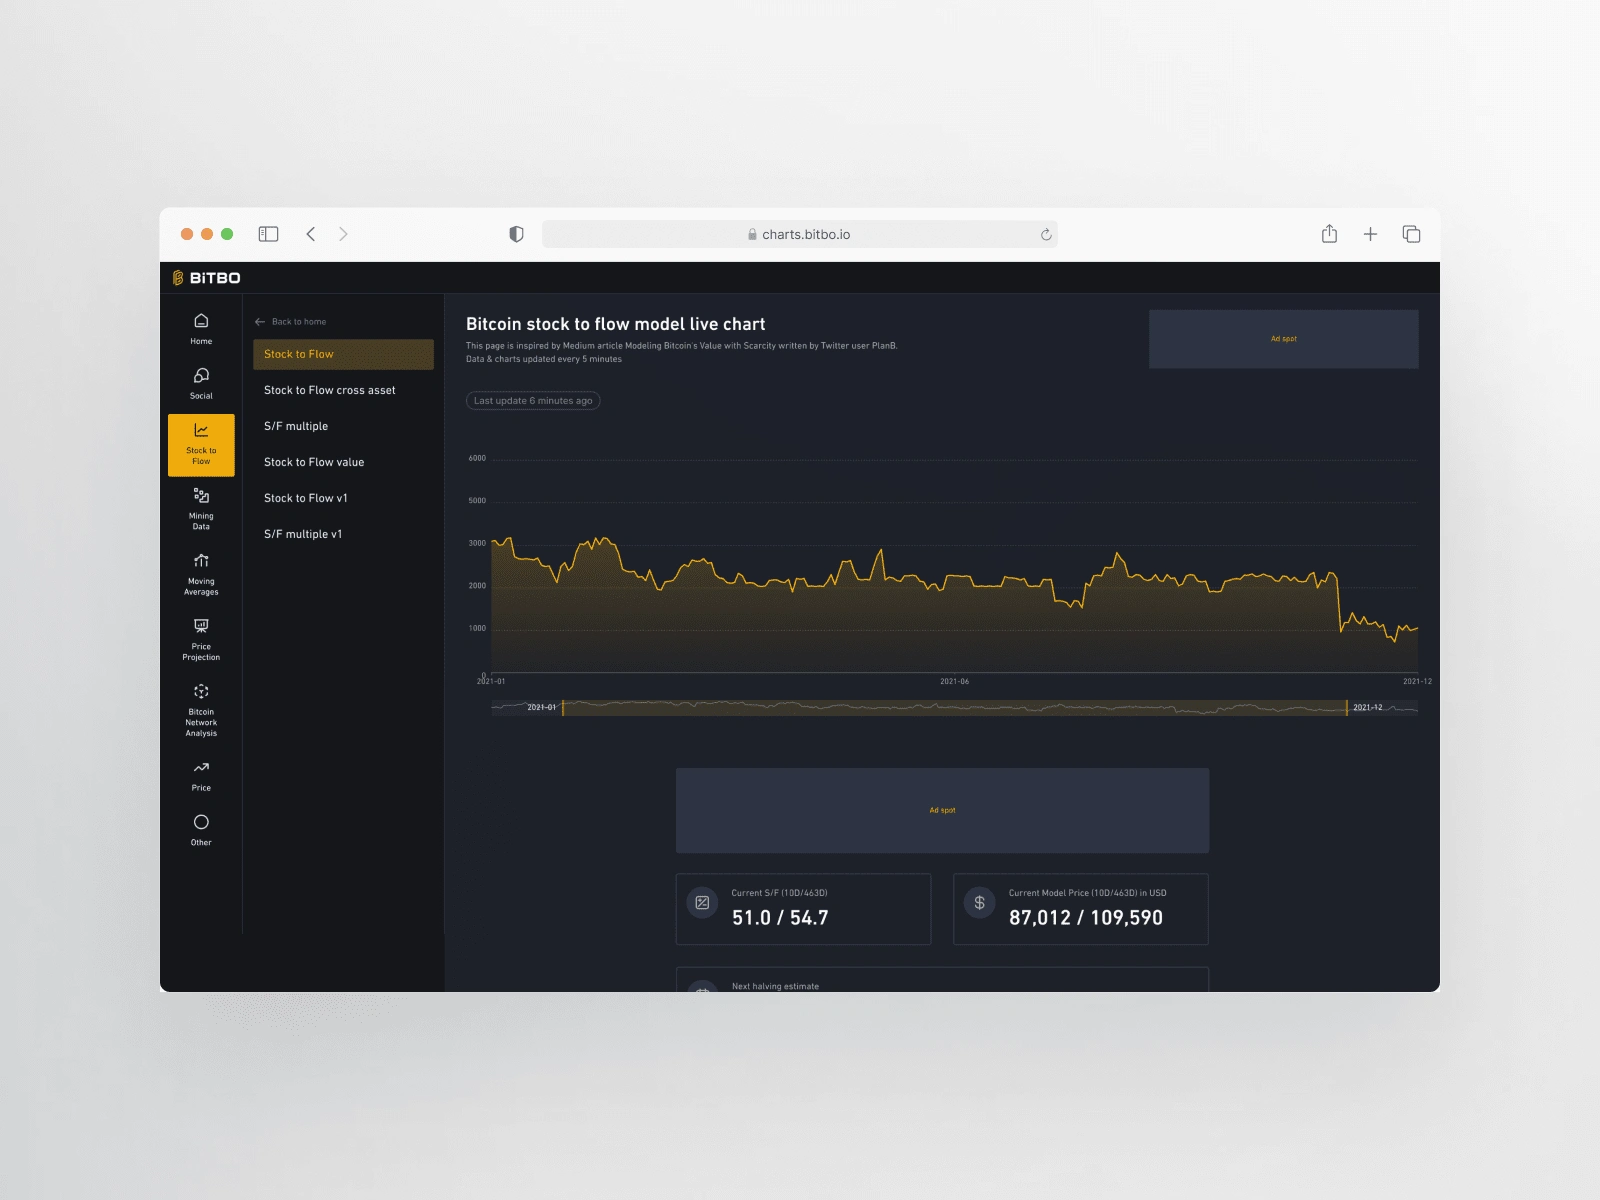
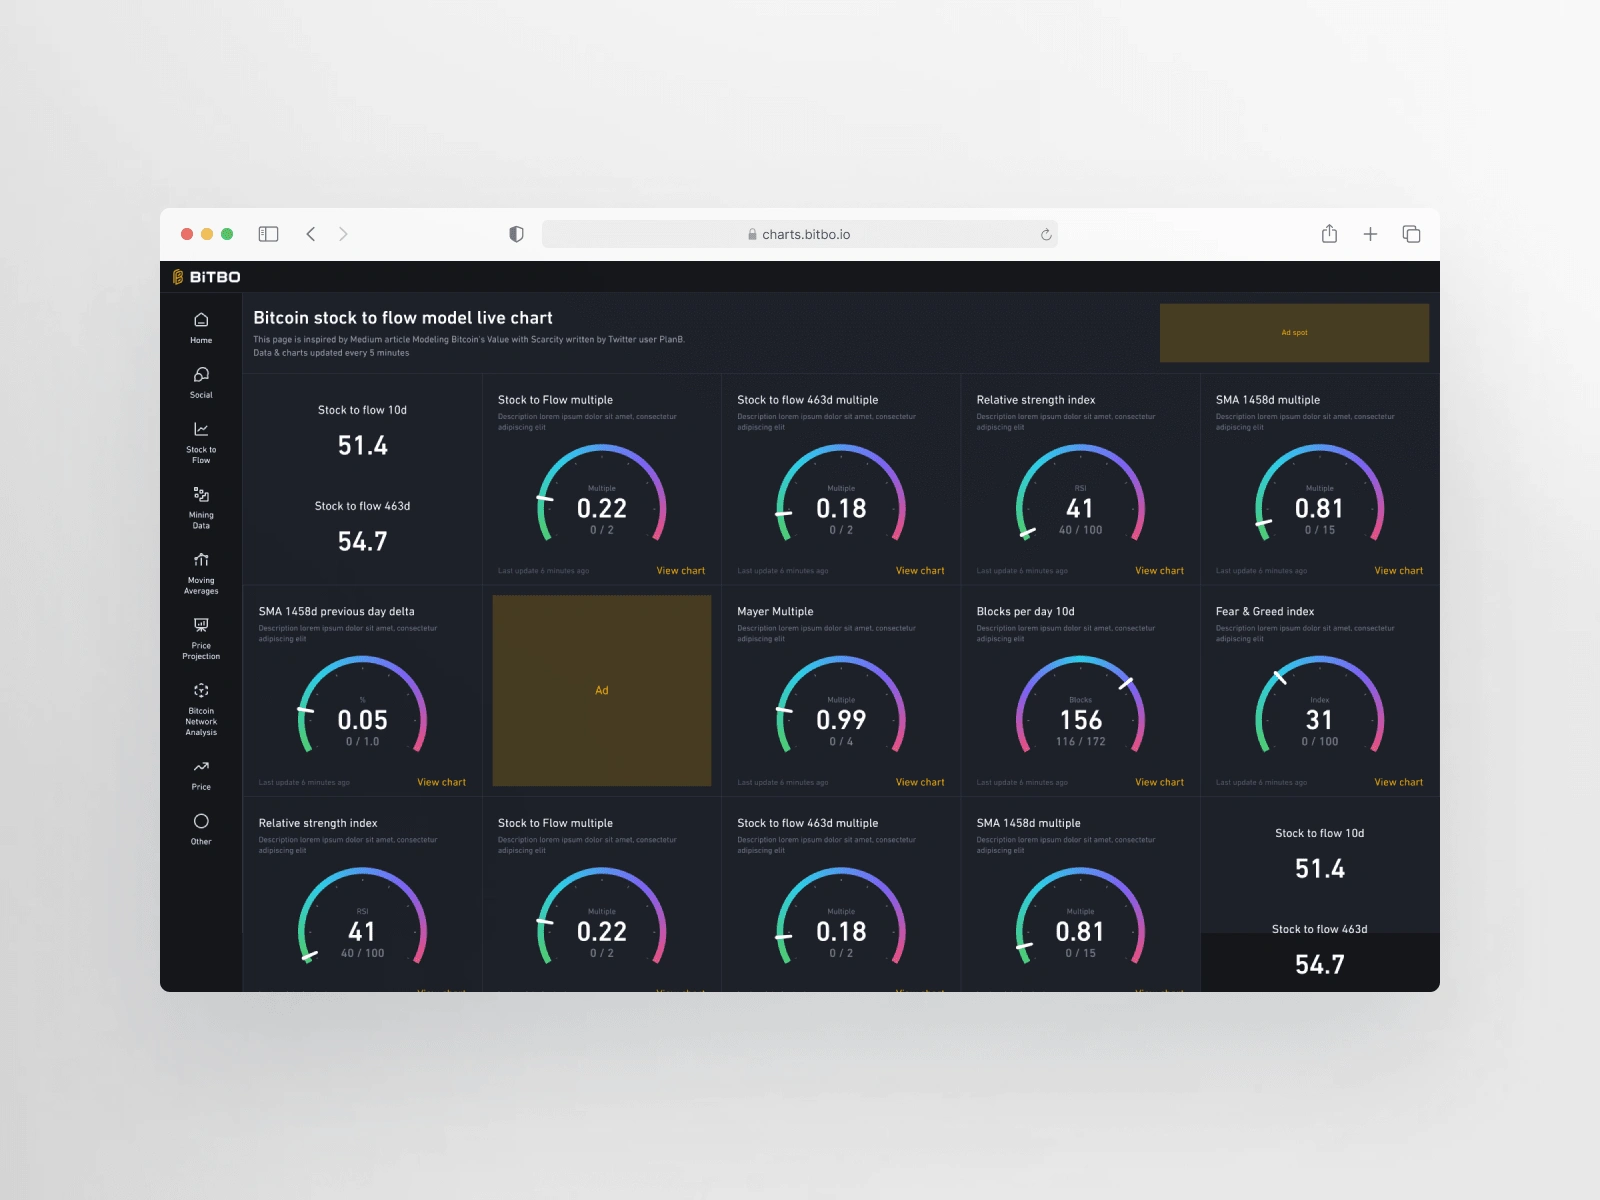
I redesigned key Bitcoin charts (Stock-to-Flow, SMA, Blocks per Day, Fear Index) on Charts.bitbo.io, created a new Calendar.bitbo.io page, and revamped blog posts for Charts.bitbo.io/stock-to-flow, improving the overall user experience and accessibility of Bitcoin data.
Project Brief
The goal was to elevate the user experience by redesigning the Charts.bitbo.io interface. This involved creating visually intuitive charts for Bitcoin data (Stock-to-Flow, SMA, Blocks per Day, Fear Index), designing a clean and functional Calendar.bitbo.io page, and enhancing blog post layouts to present complex information like price projections and mining data more effectively.
Role
As the Figma designer, I was responsible for transforming Bitcoin charts and pages into user-friendly, visually cohesive designs.
Methods
I used Figma to create wireframes and high-fidelity prototypes, applying principles of information architecture, interaction design, and data visualization. Through iterative design, I collaborated closely with the development team to ensure seamless implementation of these user-centric enhancements.
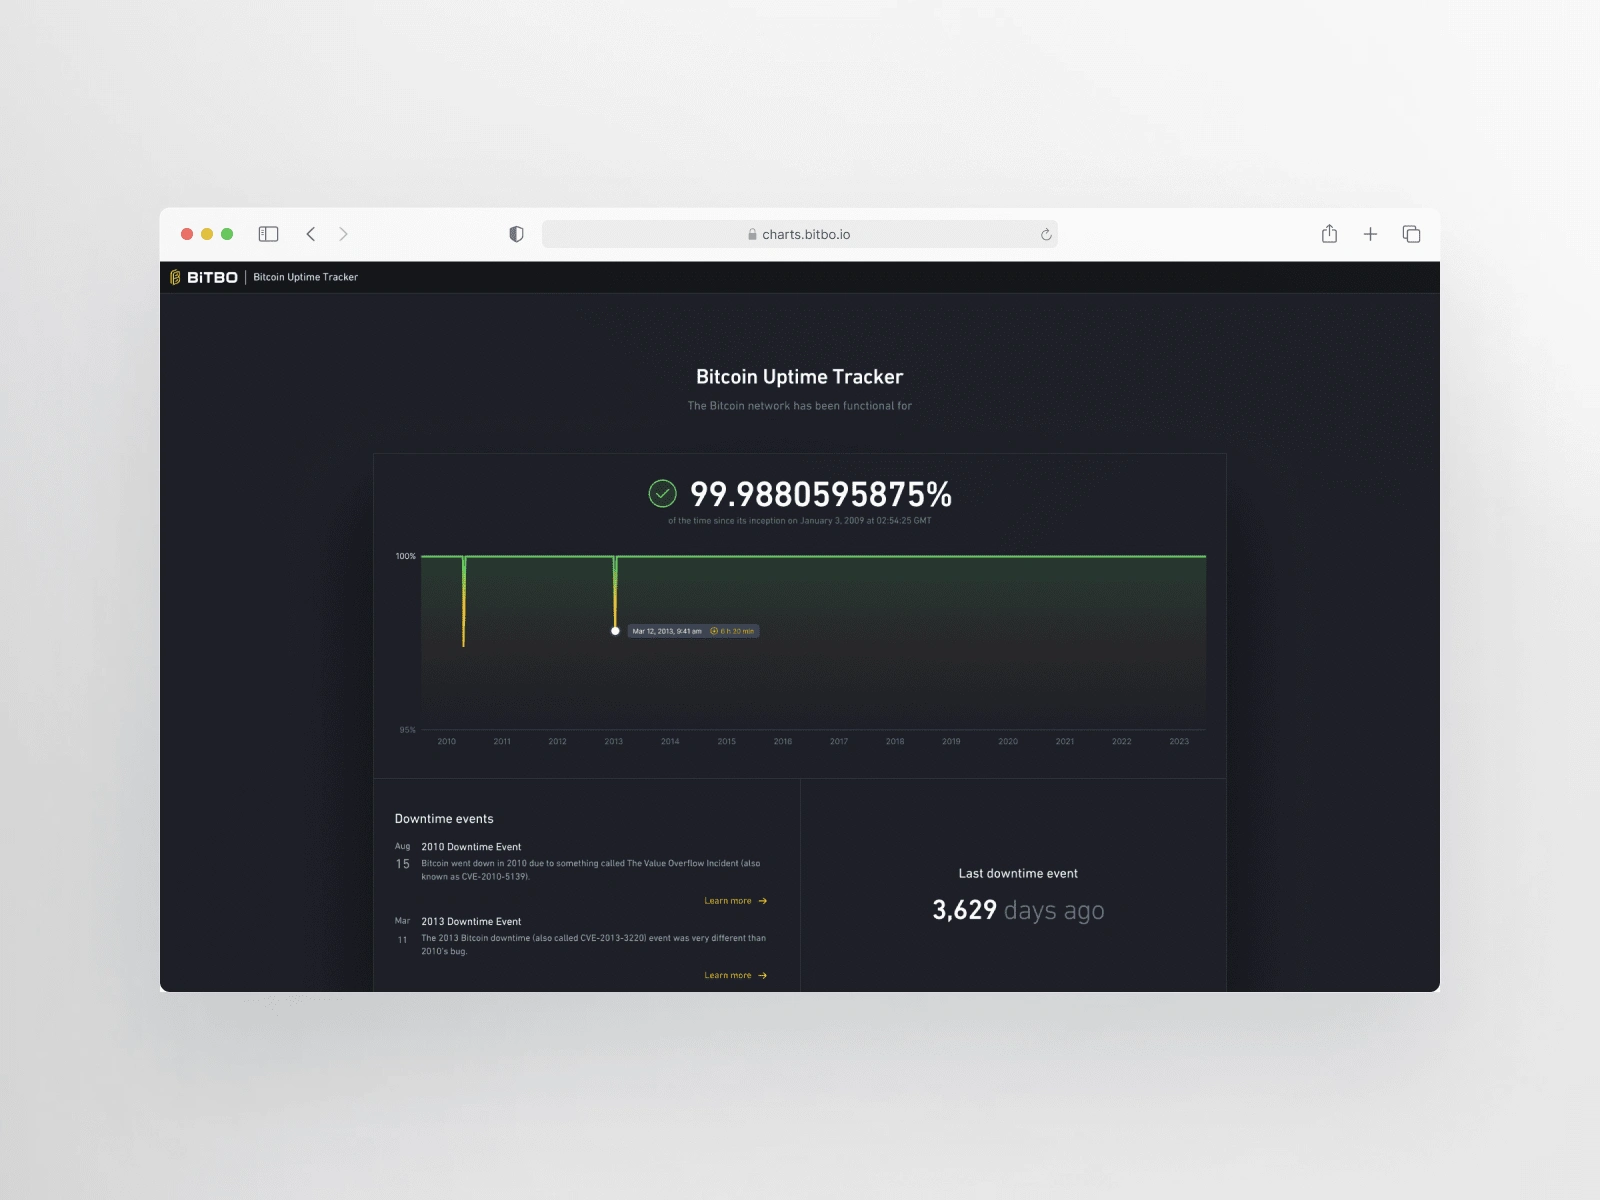
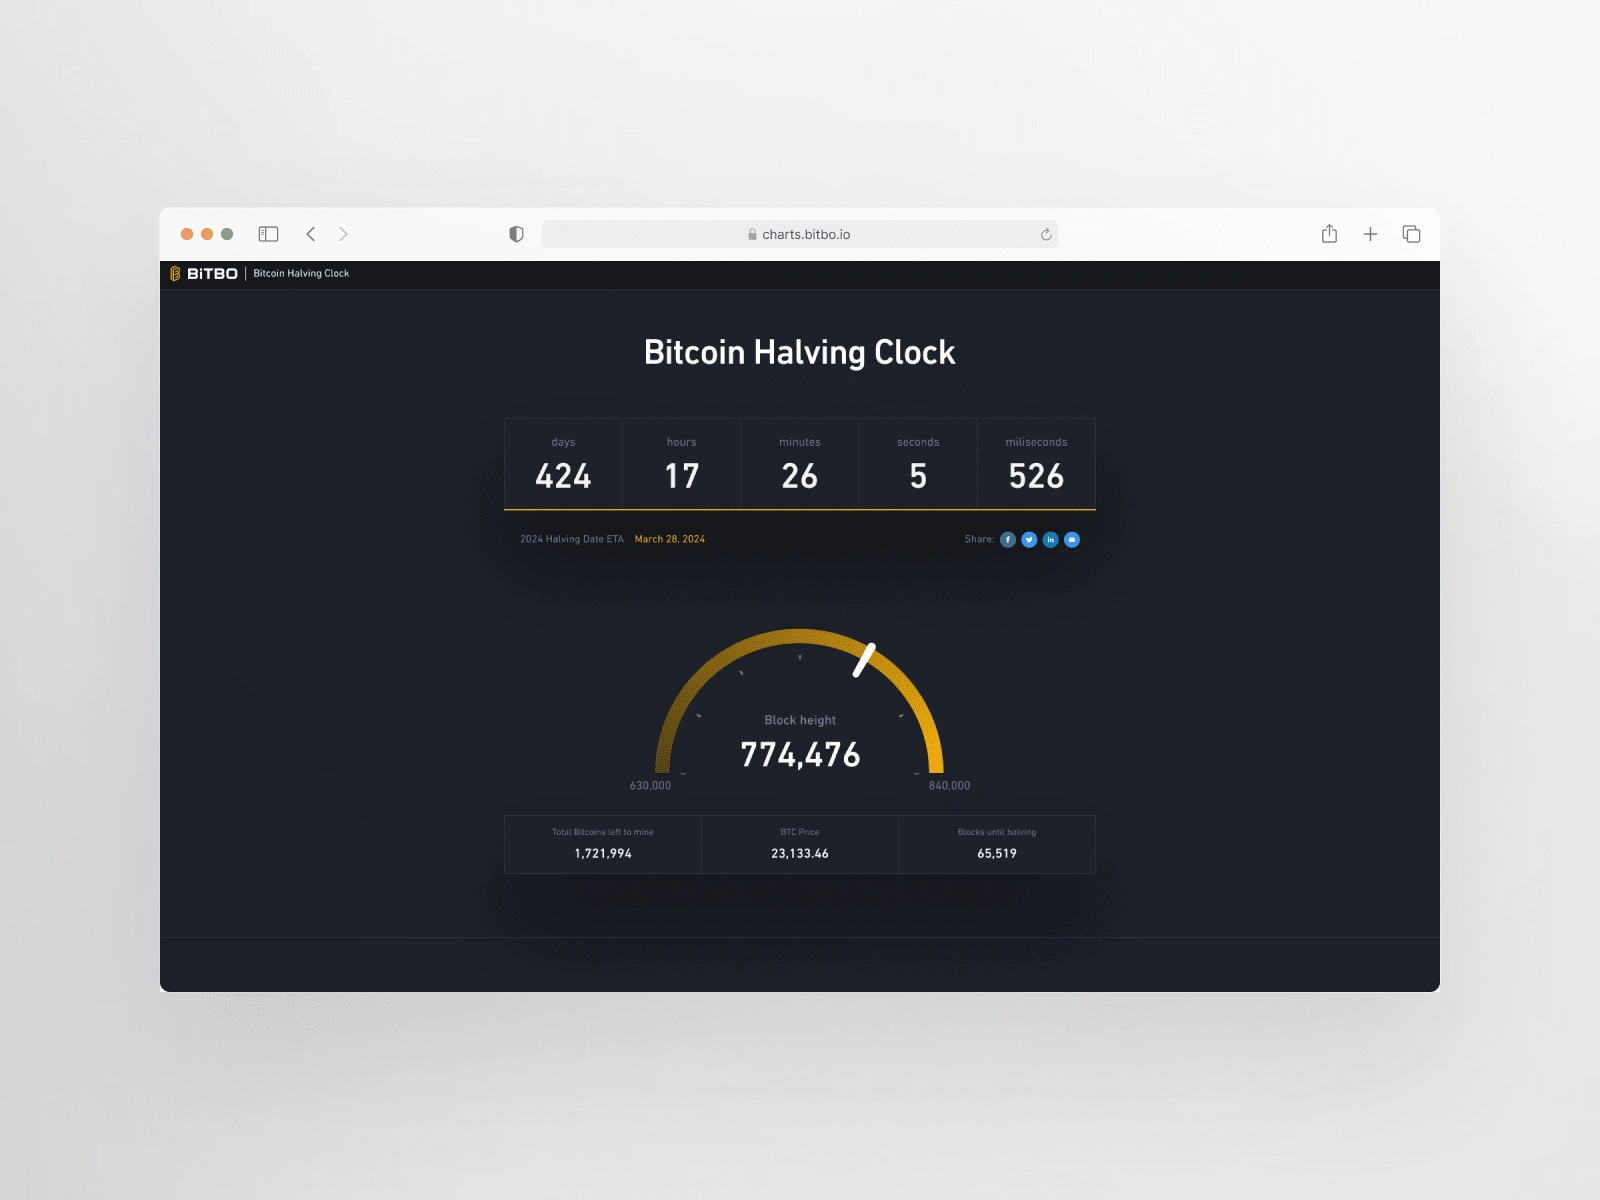
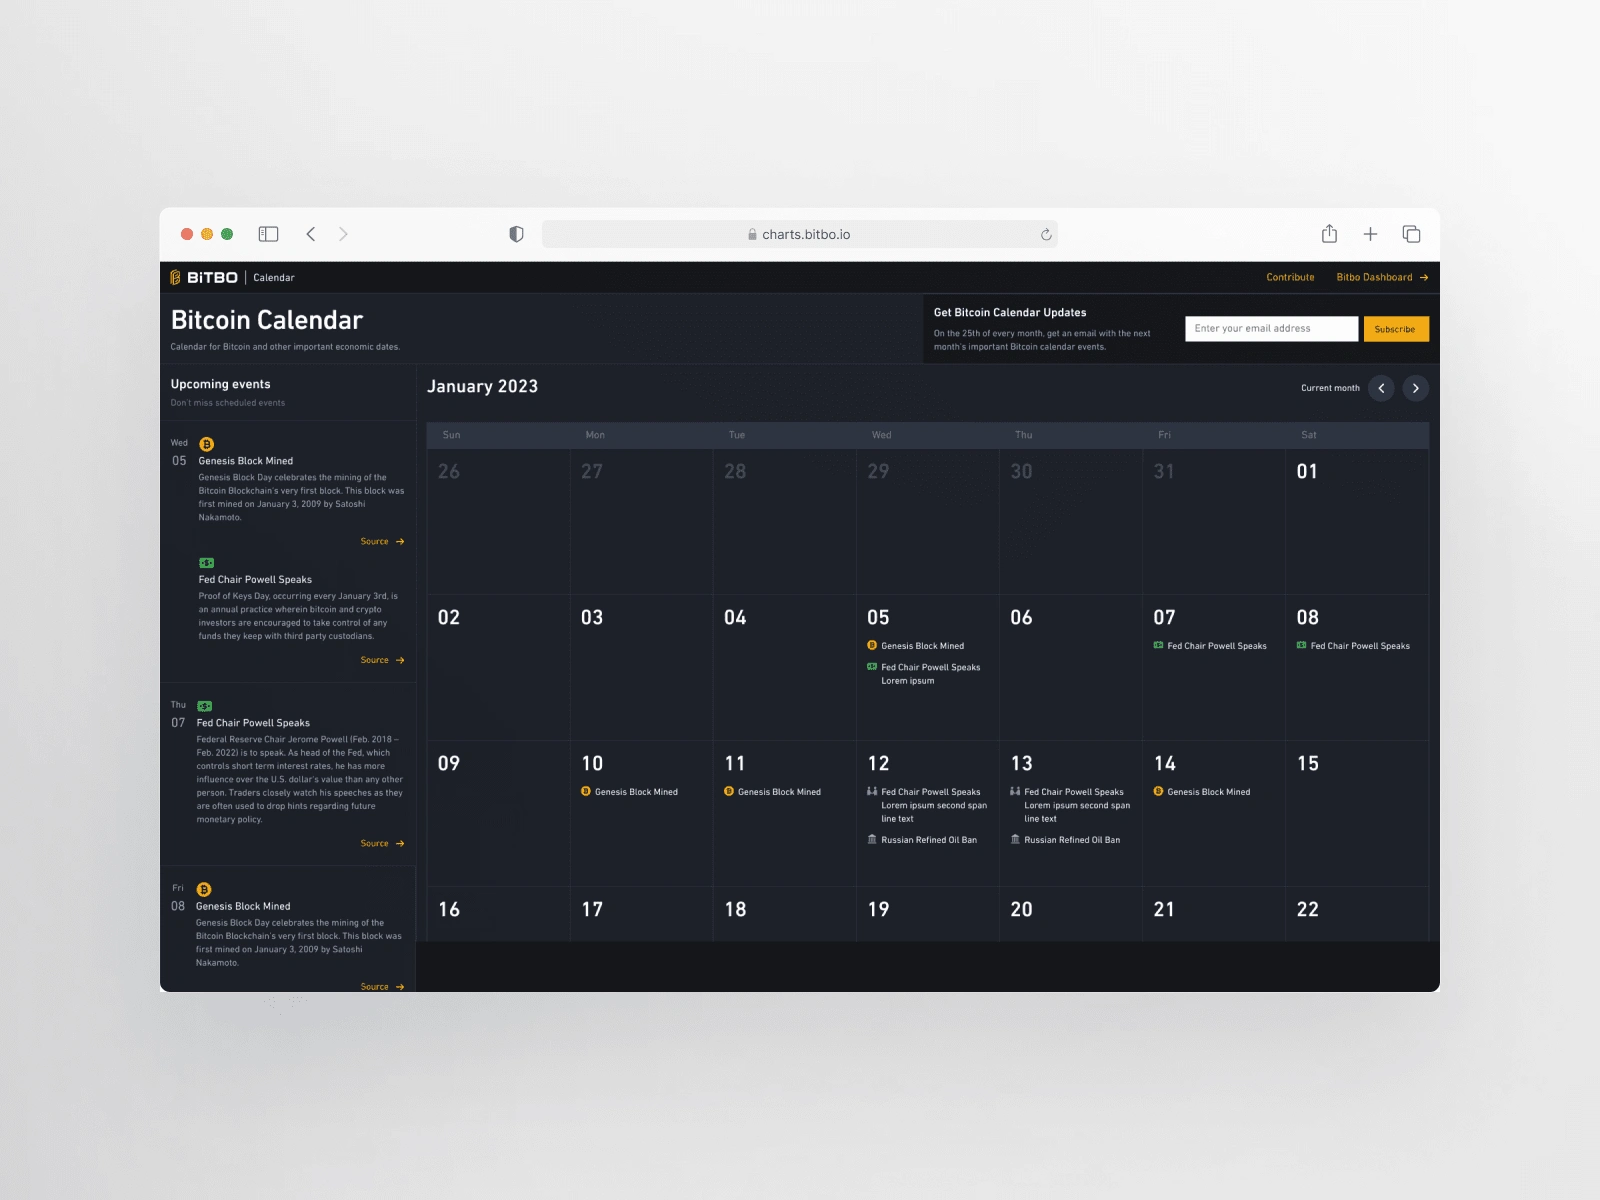
1 like · 267 views · Jul 18, 2023
I designed and improved various Bitcoin elements, such as charts, calendar, and blog posts, using user research, design principles, and data visualization.

