Safaricom Financial Performance Dashboard (FY20–FY24):
Johnson Wairimu
Safaricom Financial Performance Dashboard (FY20–FY24): Key Insights & Business Impact
The Safaricom Financial Dashboard provides a clear, data-driven view of performance over five years, highlighting both growth opportunities and critical financial pressures.
🔍 Key Findings
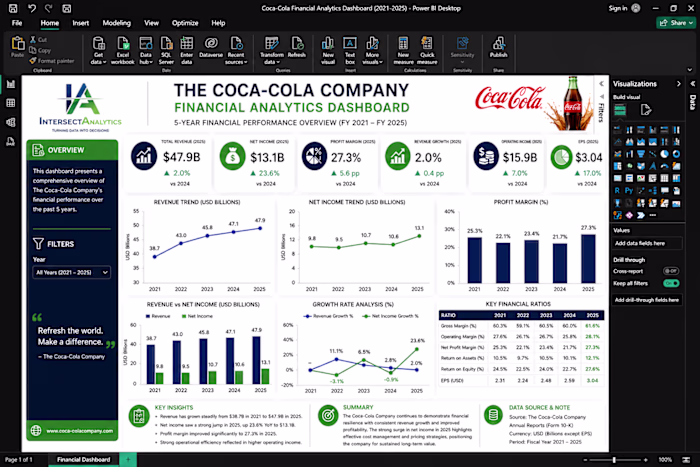
Strong Revenue Growth: Total revenue shows consistent growth, driven by digital transformation.
M-PESA Dominance: M-PESA has emerged as the largest revenue contributor, reinforcing its role as a core growth engine.
Mobile Data Expansion: Sustained growth in mobile data reflects increasing demand for digital services.
Decline in Traditional Revenue: Voice and messaging revenues continue to decline, signaling a shift in customer behavior.
Margin Pressure: Rising operating costs, direct costs, and ECL provisions are compressing profitability.
Profitability Decline: Net profit has decreased despite revenue growth—highlighting inefficiencies.
Cash Flow Concerns: Declining free cash flow indicates increasing capital demands.
High Dividend Payouts: Continued strong dividends despite cash flow pressure raise sustainability questions.
🚀 What This Means for Businesses
Growth alone is not enough — cost optimization and efficiency are critical
Businesses must track performance beyond revenue to understand true profitability
Real-time insights are essential to respond quickly to financial risks and opportunities
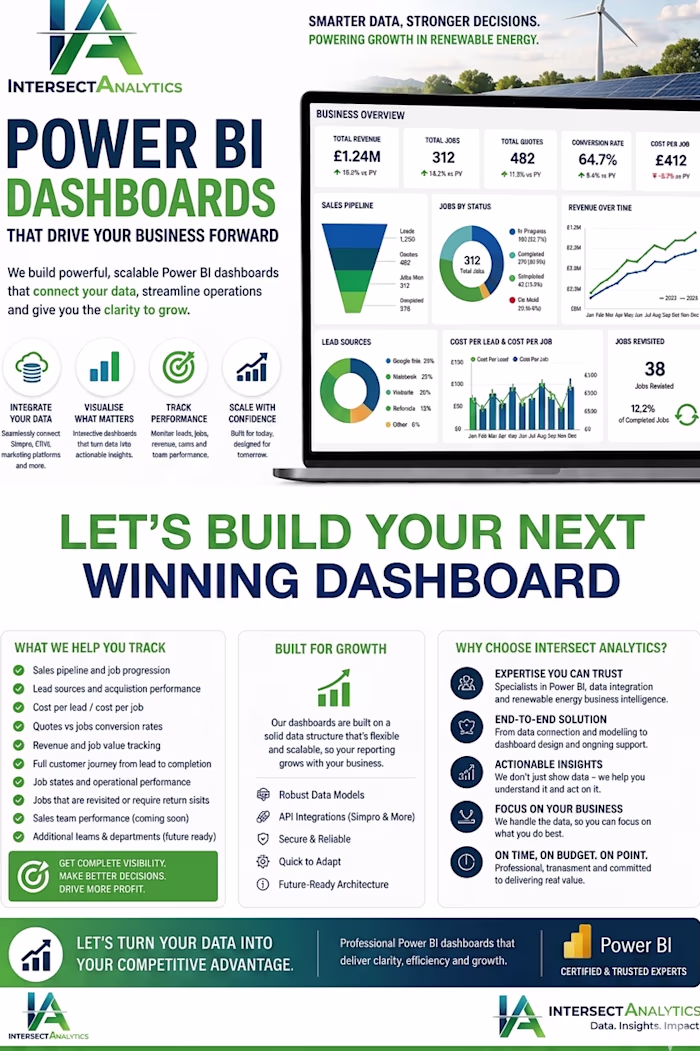
💼 How Intersect Analytics Adds Value
At Intersect Analytics, we go beyond dashboards — we deliver decision intelligence.
📊 Financial Analytics Expertise
Deep understanding of financial metrics, KPIs, and business drivers
⚙️ Custom Power BI Dashboards
Interactive, scalable dashboards tailored to your business needs
🔗 Data Integration & Automation
Seamless connection of multiple data sources with automated reporting
📈 Insight-Driven Decision Making
We don’t just show data — we explain the “why” behind it
🧠 Strategic Approach
Combining finance, analytics, and business strategy for real impact
✅ Why Choose Intersect Analytics
Proven experience in financial analytics & dashboard development
Solutions designed for clarity, scalability, and performance tracking
Strong focus on business impact — not just visuals
Reliable partner for end-to-end analytics and continuous support
📩 Looking to transform your financial data into actionable insights?
Let Intersect Analytics build a powerful, intelligent dashboard that drives smarter decisions and business growth.
Like this project
Posted May 6, 2026
Safaricom Financial Performance Dashboard (FY20–FY24): Key Insights & Business Impact The Safaricom Financial Dashboard provides a clear, data-driven view of...