🚀 Financial Analytics Dashboard |
Johnson Wairimu
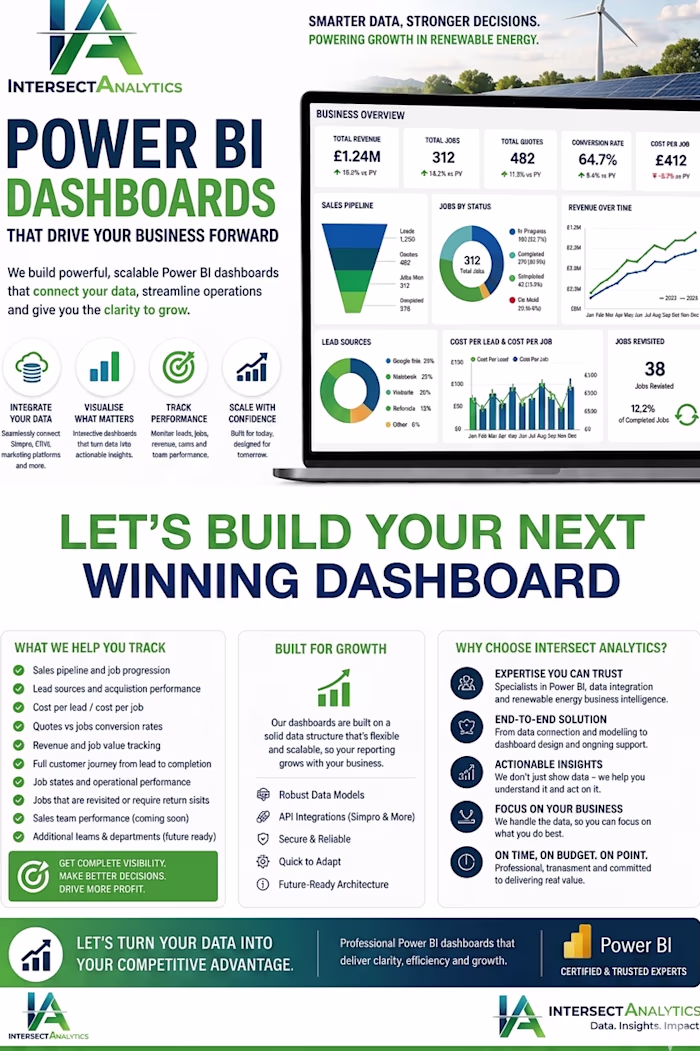
🚀 Financial Analytics Dashboard | Power BI, Excel & Data Automation Experts
Turn your business data into clear, actionable insights with a professionally built Financial Analytics Dashboard. This Coca-Cola case study demonstrates how structured data, KPI tracking, and advanced visualization can uncover trends, improve profitability, and support smarter decision-making.
📊 What This Analysis Shows
Consistent revenue growth over 5 years
Strong profit margin expansion and cost efficiency
Clear visibility into financial performance trends
Data-driven insights for strategic planning and forecasting
💼 Our Services
We help businesses unlock the full value of their data through:
✔ Power BI Dashboard Development (interactive, executive-ready)
✔ Financial Analysis & Modeling (profitability, forecasting, KPIs)
✔ Excel & Google Sheets Automation (reports, dashboards, workflows)
✔ Data Cleaning & Transformation (structured, reliable datasets)
✔ Business Intelligence Solutions (end-to-end analytics systems)
🛠️ Tools We Use
Power BI • Excel • SQL • Python • Tableau • Google Sheets
⭐ Why Work With Us
Data-driven, business-focused insights
Clean, professional, and decision-ready dashboards
Scalable solutions that grow with your business
Strong expertise in finance, analytics, and automation
🎯 Who This Is For
Businesses needing financial dashboards
Companies struggling with manual reporting
Teams looking to automate data workflows
Decision-makers who want real-time insights
📩 Let’s build your custom analytics dashboard today
📱 WhatsApp: +254 723 632 207
👉 Don’t just collect data — turn it into a competitive advantage.
Like this project
Posted May 5, 2026
🚀 Financial Analytics Dashboard | Power BI, Excel & Data Automation Experts Turn your business data into clear, actionable insights with a professionally bu...