Tableau: Baseball Analytics Dashboard
Altaf Safi
Team Project for my MBA Operation Management course, specifically covering Prescriptive Analytics
Introduction
In the exciting world of professional baseball, data analytics has become an indispensable tool for making informed decisions. We have created a baseball analytics dashboard, specifically designed to assist the San Diego Padres in signing up the best 8 player to bolster their team for the upcoming season. We'll explore how a dataset in an Excel document was utilized, the development of codes in R-studio to build the dashboard, and the methodology employed to identify the optimal players while adhering to the proposed constraints.
Our decision variables were to find the best 8 players that would meet certain constraints and minimize the salary cost for the upcoming Padres as an objective function. The constraints that we adhered included the following: Firstly, the average salary of all 8 players must not exceed $10 million. Secondly, each player must occupy a distinct outfield position. Thirdly, the maximum probability of games missed by the 8 players should not surpass 18% and the maximum probability of injury should not exceed 18%. Lastly, each player's individual win percentage must be at the minimum 50% or higher.
The journey began by gathering valuable data on 271 baseball players (free agents) from a trusted source called “Spotrac.com.” This dataset included essential player information like names, positions, ages, and 2023 tax salaries. In the process, we used the random function on Excel to count the number of wins. This allowed us to compute the corresponding values for losses, win percentage, and the cost-effectiveness ratio known as Dollar to Win. Similarly, we utilized the random function to generate probabilities of injury, enabling us to calculate the number of missed games due to injuries, the percentage of games missed, and the salary that became ineffective as a result of injuries. Through these functions, we generated insightful data points such as wins, losses, win percentage, dollar to win ratio, probability of injury, missed games due to injury, and percentage of missed games.
After cleaning up the data and making some modifications by assigning values, we then went on using the cleaned data set to set our optimization model using the “LPSolveAPI.” The goal was to transform the raw data into a visually appealing and user-friendly dashboard, providing an intuitive interface for decision-makers. To accomplish this, we also used the capabilities of other R packages such as Flexdashboard, and Shiny.
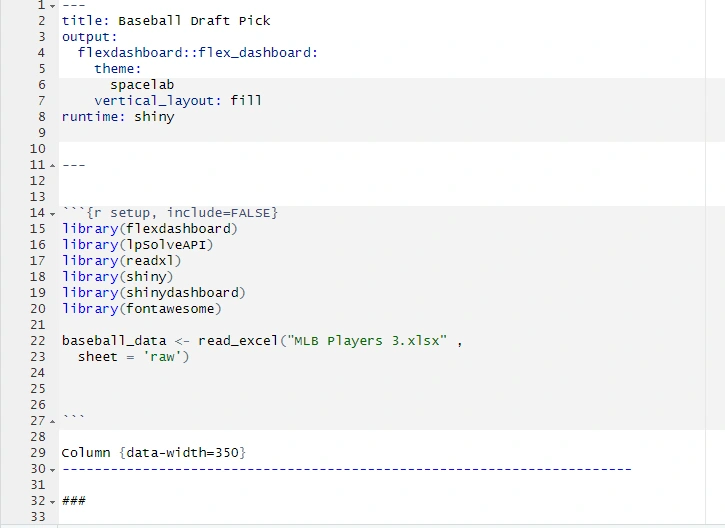
R-Studio Coding Analysis
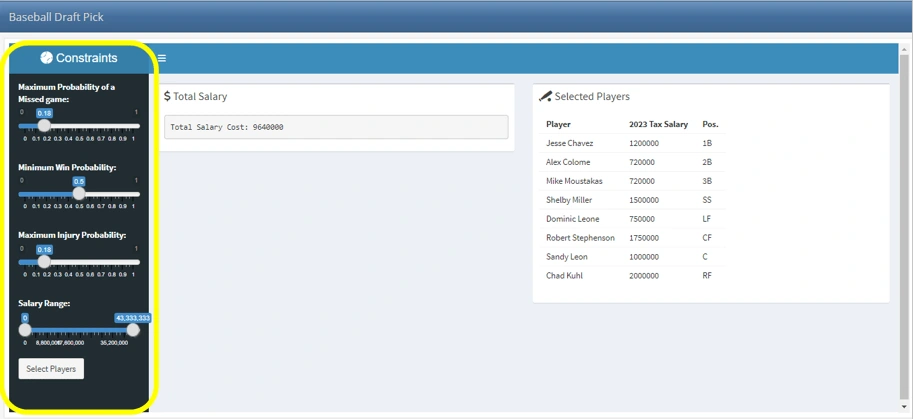
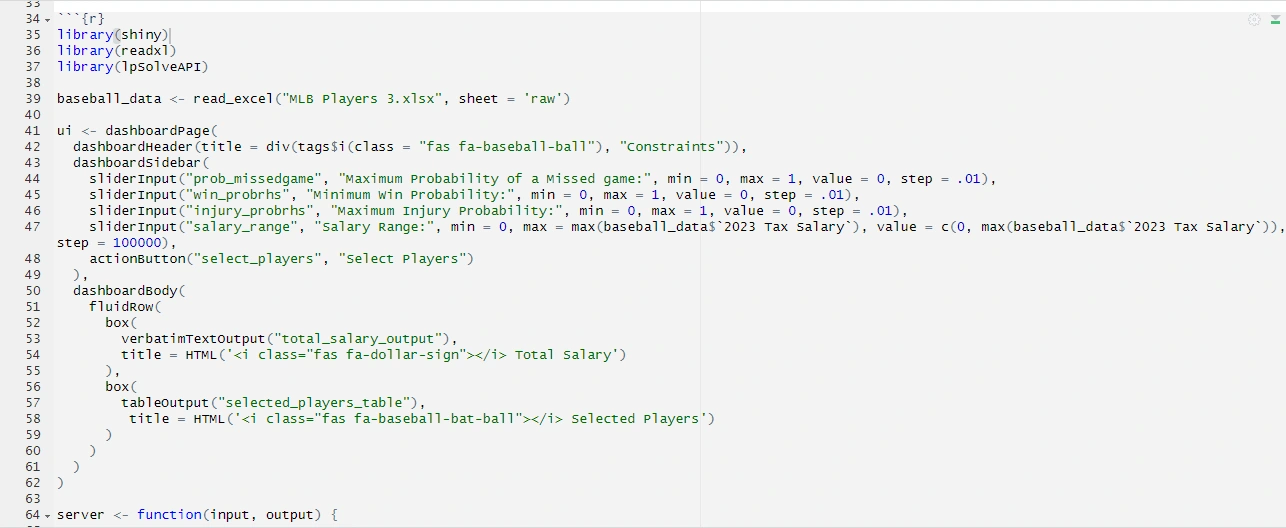
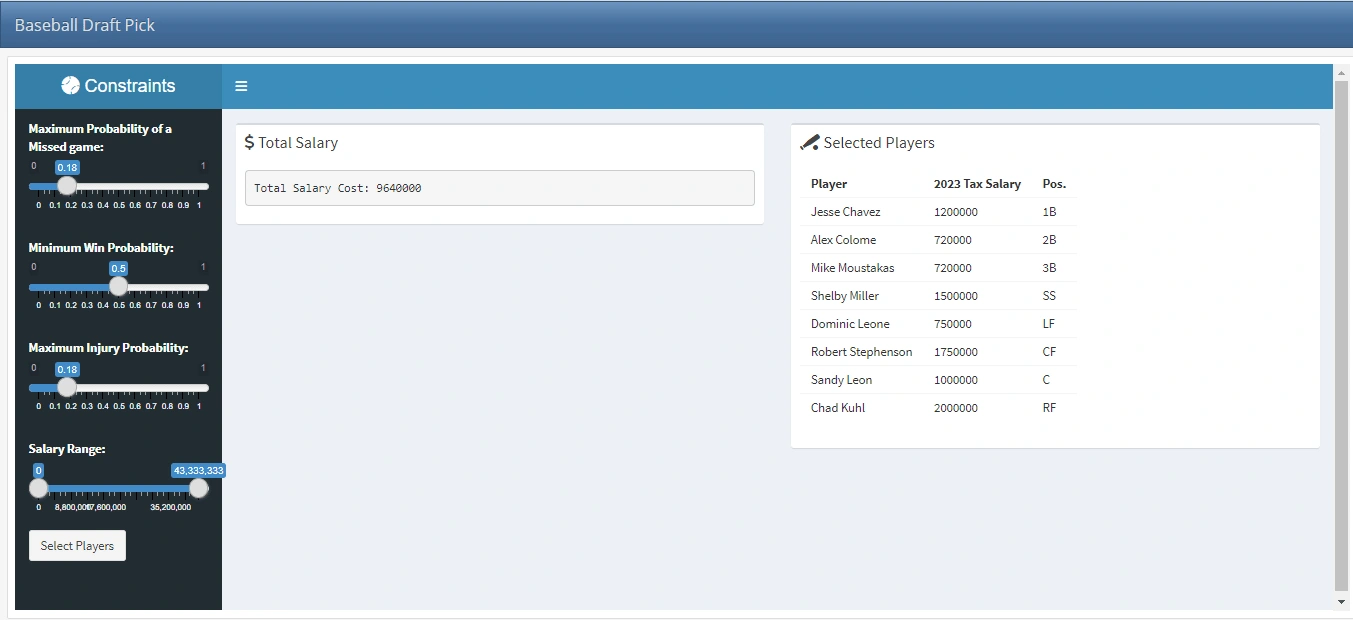
Within our R-Markdown, we designed the layout of the dashboard using functions like dashboard header and dashboard sidebar, setting the title and input elements such as sliders. We have four sliders, which help in finding the total salary box and the player names with the specified constraints and salaries. These four sliders allow users to select parameters like the maximum probability of missed games, minimum win probability, maximum injury probability, and salary range in millions. To activate the player selection process, we incorporated an action button at the bottom of the sliders, as seen in the left side of the dashboard (highlighted in yellow).
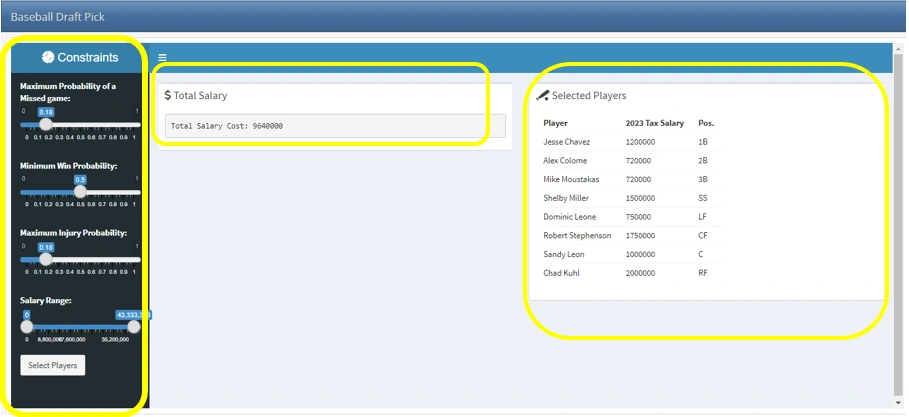
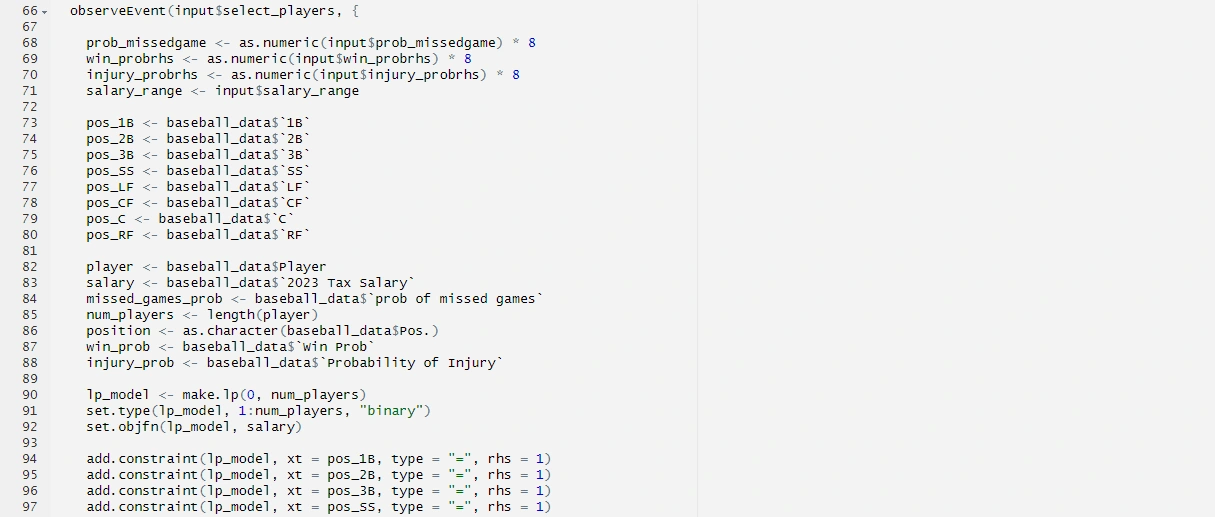
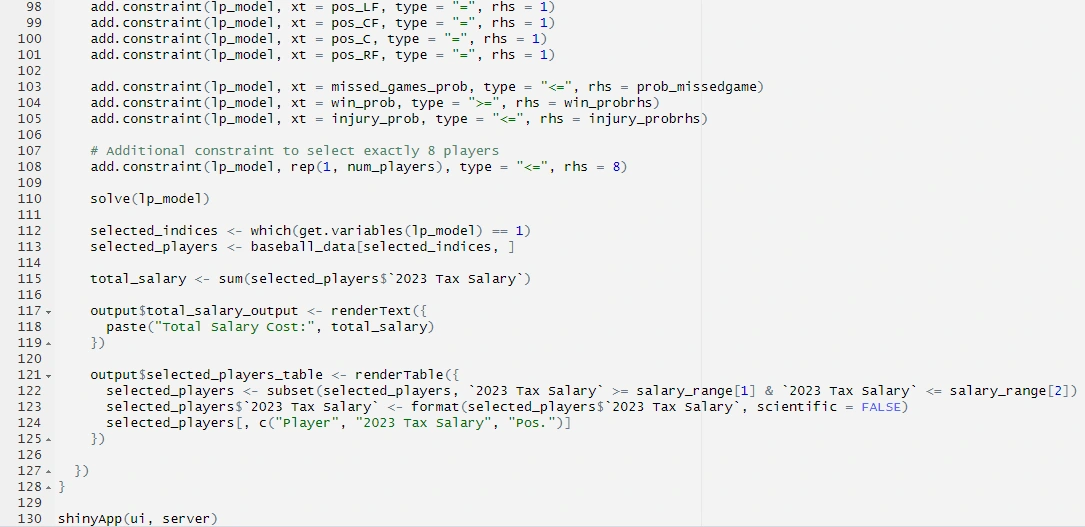
We were able to create the visual presentation of the dashboard with the help of the fluid rows and boxes within the dashboard body. The “Verbatim Text Output” function allowed us to display the total salary output, while the “Table Output” function generated the table showcasing the selected players. To optimize the player selection process, we built a linear programming model using the “lpSolveAPI” package. The model aimed to minimize the total salary cost while following to the specific constraints. We added constraints to ensure that one player was selected for each outfield position, the average missed game probability, average win probability, and the total salary within the specified ranges. An additional constraint was also added to select exactly 8 players. The model's decision variables correspond to the players, and their coefficients are set to the respective salaries using the “set.obj” function.
After that, the solve function was used to find the optimal solution, all of which satisfied all the constraints. By examining the variables with a value of 1 in the LP model, we identified the selected players. The sum function allowed us to calculate the total salary of the chosen players. To provide a dynamic display, we utilized the “renderText” and “renderTable” functions. The “renderText” function formatted the total salary output, while the “renderTable” function showcased the table of selected players. We also made sure to subset the selected players based on the salary range and format the salary values for better readability.
Additionally, in our coding process, we retrieved the input values from the sliders and salary range, to then scale them by multiplying them by 8 to match the units used in the data set. Scaling allows our values to align with the dataset, leading for accurate comparison and calculation. Moreover, constraints were then added to the model to enforce specific conditions. These constraints ensure that exactly one player is selected for each position, including infield positions (1B, 2B, 3B, SS), outfield positions (LF, CF, RF), and the catcher position (C). Additionally, constraints are included to limit the average missed game probability, average win probability, and total salary based on the scaled input values. Another constraint ensures that exactly 8 players are selected for the team.
Lastly, the total salary of the selected players is calculated by summing their salaries, providing an understanding of the team's cost. This information is then dynamically displayed on the dashboard using the “renderText” function.
Dashboard Results
As we hover on the sliders to meet the constraints specified for the San Diego Padres, we were able to find the best 8 players whose total salary would cost $9,640,000 for the upcoming season. The best 8 players are Jesse Chavez, Alex Colome, Mike Moustakas, Shelby Miller, Dominic Leone, Robert Stephenson, Sandy Leon, and Chad Kuhl. Each player demanding a specified tax salary in 2023 to meet the Padre’s cost budget and talent level. For instance, Jess Chavez will ask for $1,200,000 in salary and take the 1B field position as he is excellent in that position, Alex Colome will ask for $720,000 and take the 2B position, Mike Moustakas will ask for $720,000 and take the 3B position, Shelby Miller will ask for $1,500,000 and take the SS position in the baseball game, Dominic Leone will ask for $750,000 and take the LF position, Robert Stephenson will ask for $1,750,000 and take the CF position, Sandy Leon will ask for $1,000,000 and take the C position, and Chad Kuhl will ask for $2,000,000 and take the RF position in the Padre game. All of these optimal players and results were obtained when the maximum probability of a missed game slider is hovered across 0.18, minimum win probability set at 0.5, maximum injury probability set at 0.18, as shown in the screenshot below.
Conclusion
In conclusion, the creation of the baseball analytics dashboard using R programming, the Shiny package, and the lpSolveAPI package has empowered the San Diego Padres to make data-driven decisions in assembling their roster. By leveraging the interactive dashboard, decision-makers can adjust parameters and explore different scenarios while adhering to specific constraints. Through the optimization process, the team has identified the best 8 players, considering factors such as salary, position, missed game probabilities, and win probabilities, resulting in a competitive roster with a total salary of $9,640,000. This implementation demonstrates the value of data analytics and optimization techniques in sports decision-making, enabling teams to make strategic choices that align with their goals and budget, ultimately enhancing their chances of success on the field.
Appendix
Data Source: https://www.spotrac.com/mlb/free-agents/
Dashboard App Link: https://baseballdraftpick.shinyapps.io/baseballproject/
Like this project
Posted Dec 12, 2023
Created a baseball analytics dashboard for the San Diego Padres, optimizing player selection with constraints using Excel, R-studio, Flexdashboard, and Shiny.
Likes
0
Views
50
Clients
CSUSM College of Business