"""Daily sales register in Excel with automatic totals (demo, sample data).

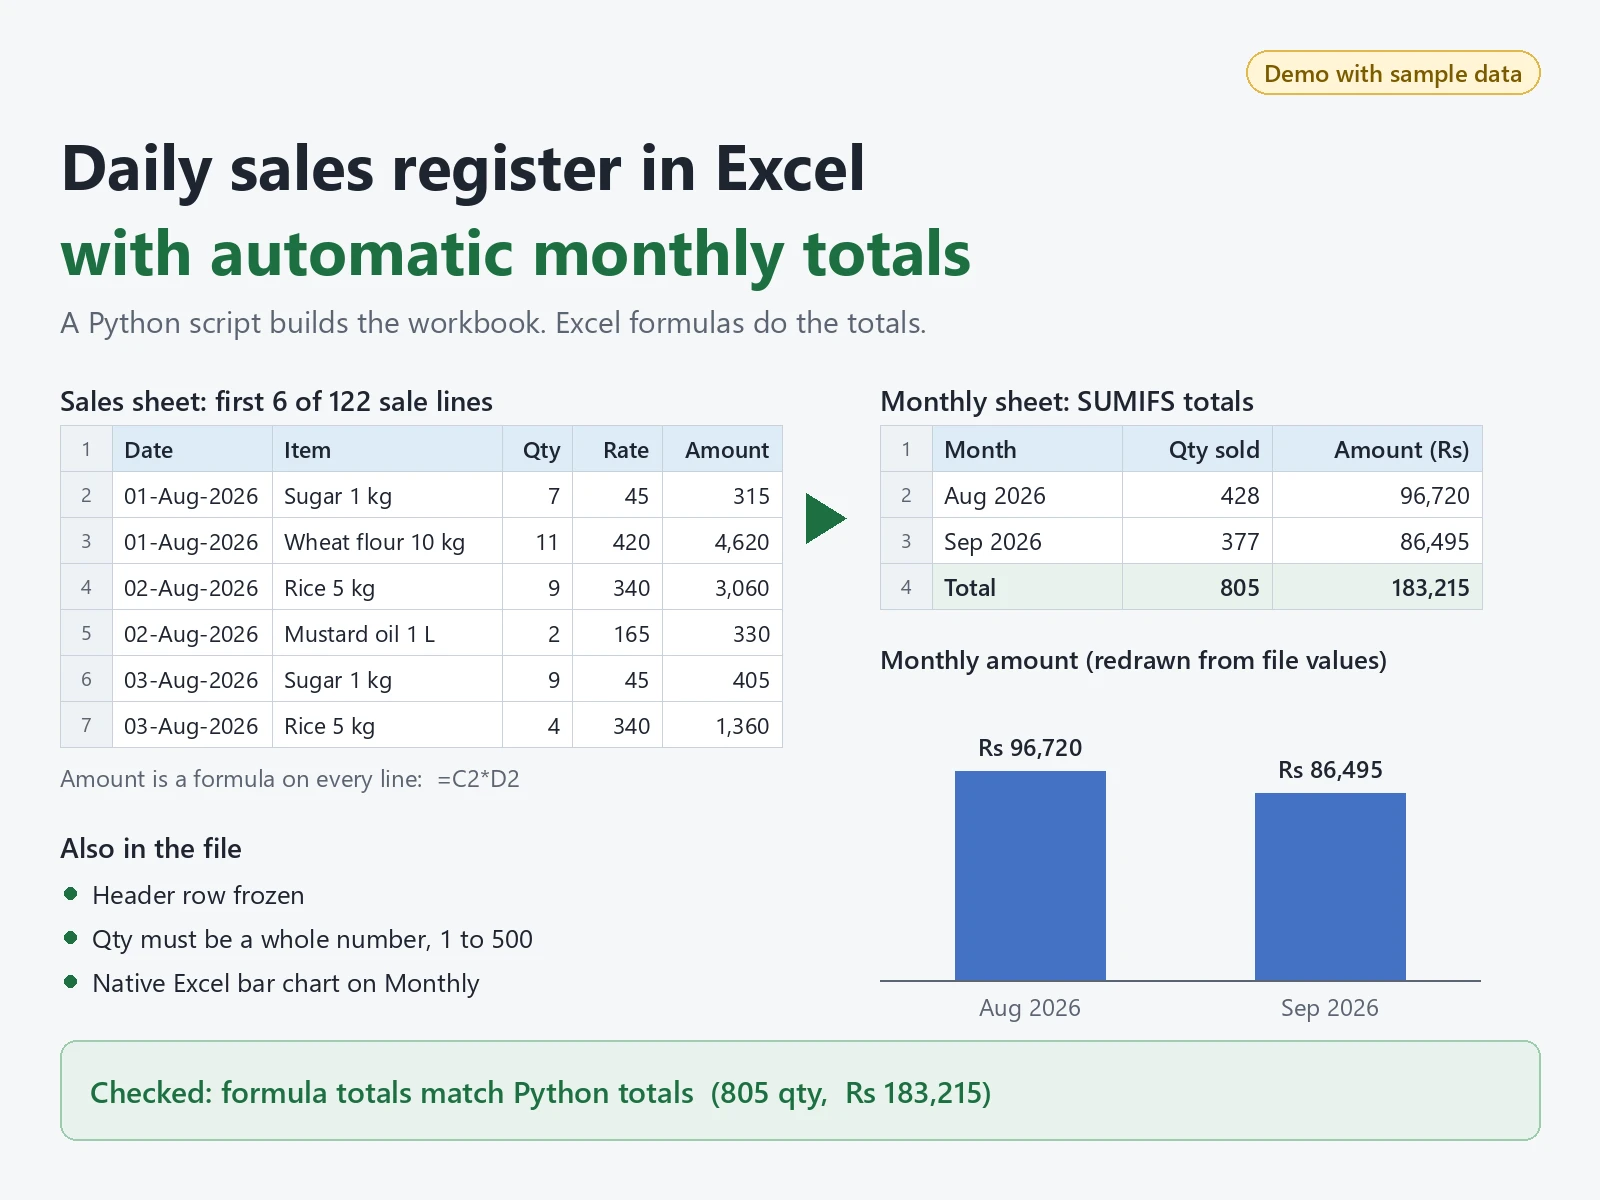
Builds sales_register.xlsx with two sheets:
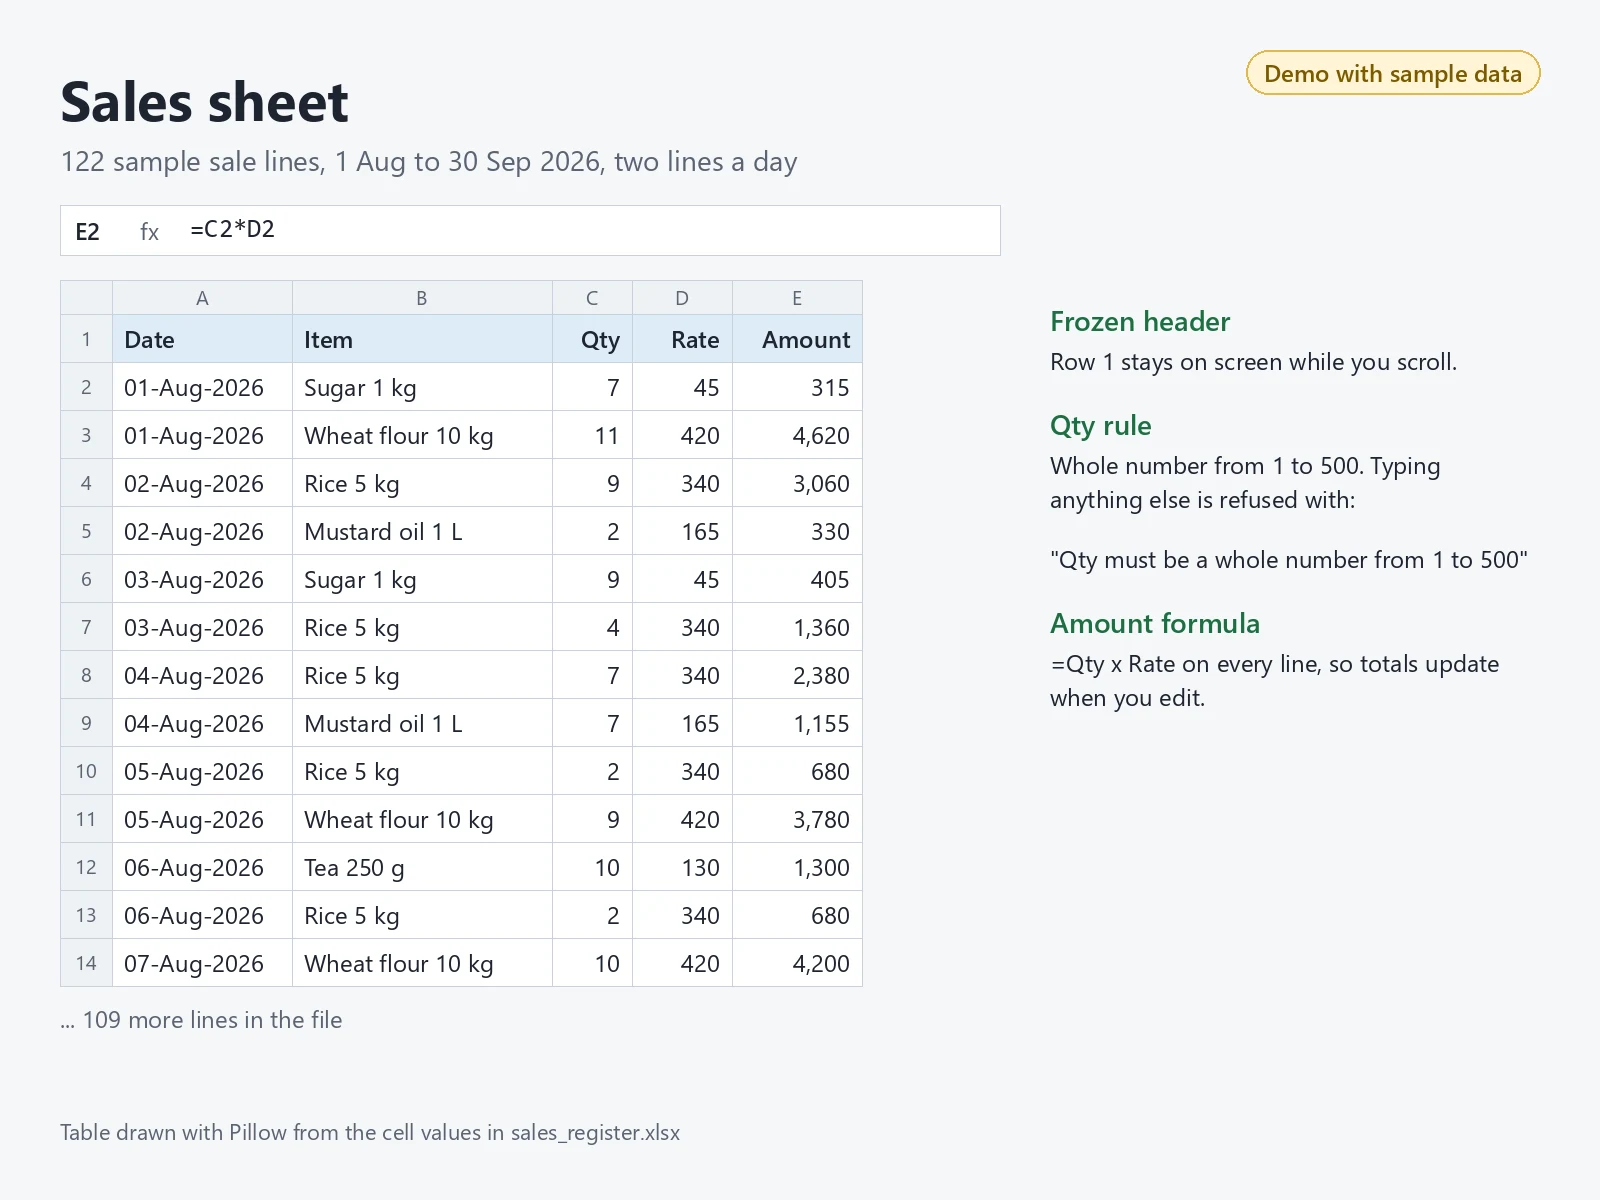
  Sales    date, item, qty, rate and an Amount formula (=Qty*Rate),
           a frozen header row, and a rule that Qty must be a whole number 1 to 500.
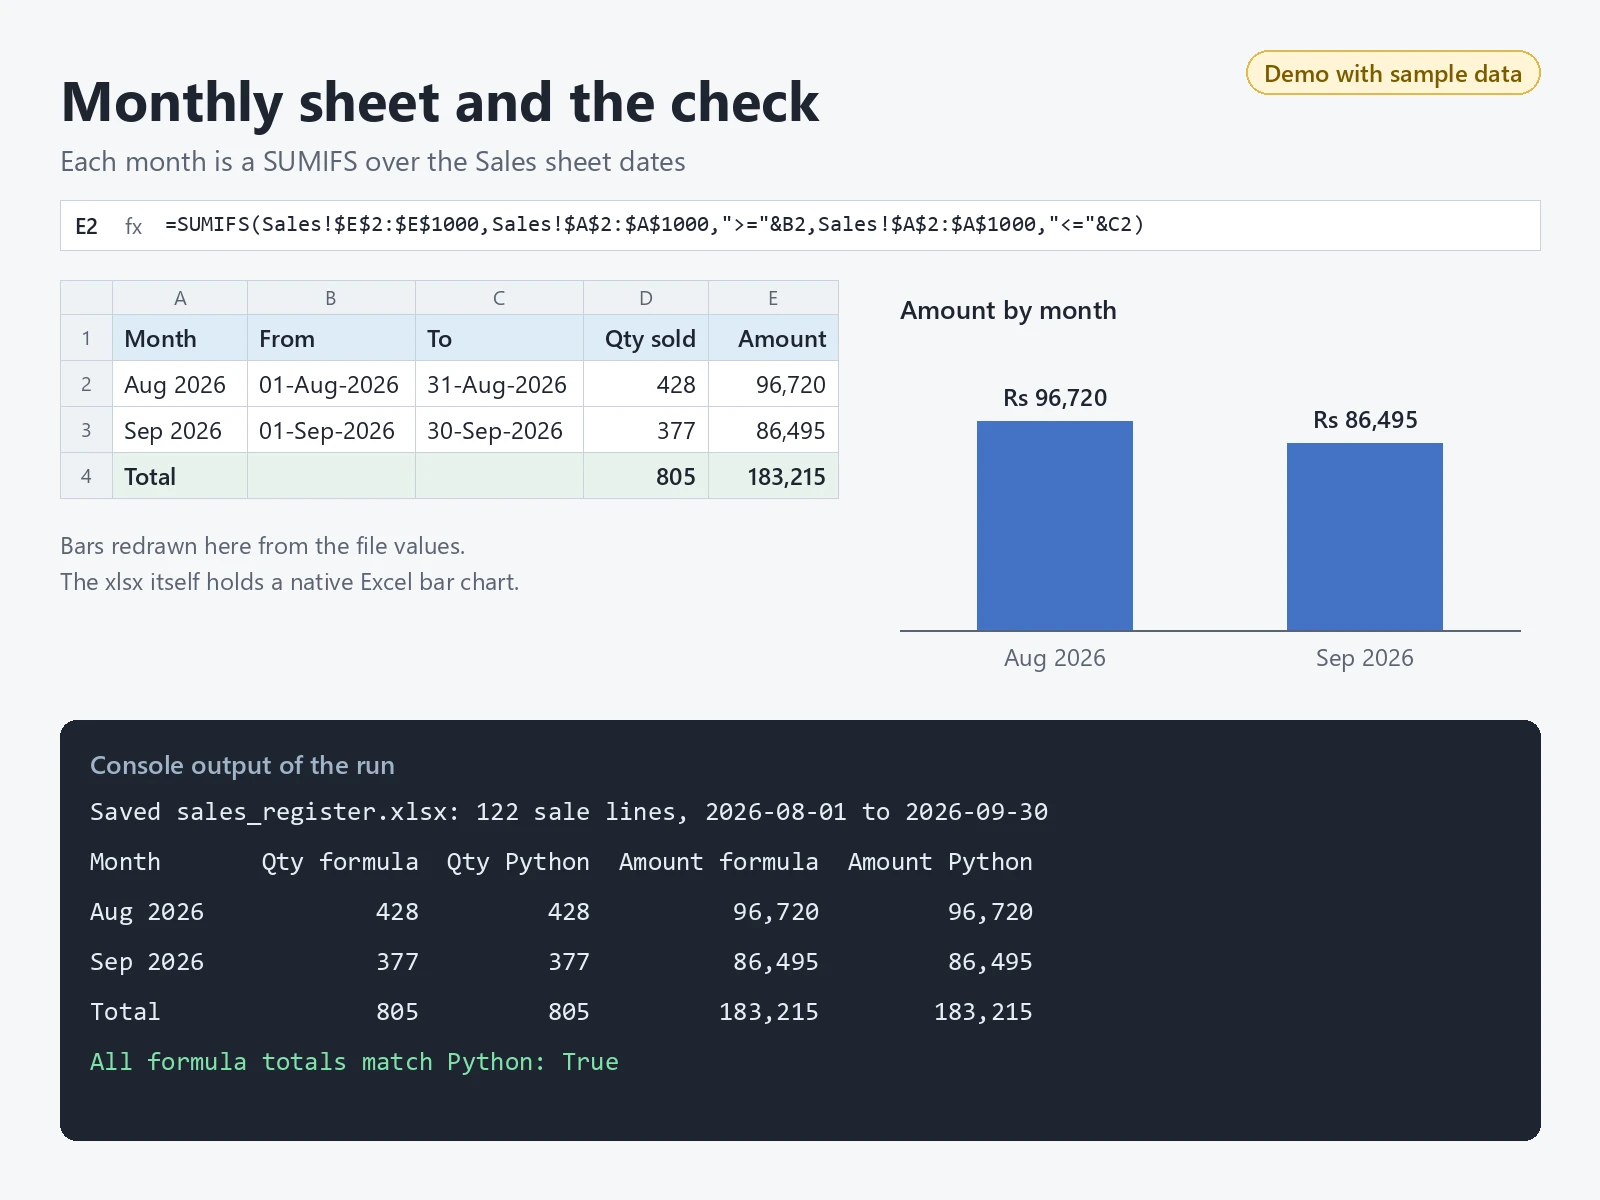
  Monthly  SUMIFS totals of qty and amount for each month, a total row,
           and a native Excel bar chart of the monthly amounts.
Then it checks the formulas: pycel evaluates them from the saved file and the
same totals are worked out again in plain Python. Both are printed.

Run:  python sales_register.py      (needs openpyxl and pycel)
"""
import random
from datetime import date, timedelta

from openpyxl import Workbook
from openpyxl.chart import BarChart, Reference
from openpyxl.styles import Font, PatternFill
from openpyxl.worksheet.datavalidation import DataValidation
from pycel import ExcelCompiler

FILE = "sales_register.xlsx"
ITEMS = {"Rice 5 kg": 340, "Wheat flour 10 kg": 420, "Sugar 1 kg": 45,
         "Tea 250 g": 130, "Mustard oil 1 L": 165}           # item: rate in Rs
MONTHS = [(date(2026, 8, 1), date(2026, 8, 31)), (date(2026, 9, 1), date(2026, 9, 30))]
MAX_ROW = 1000                                                # totals and the qty rule cover rows 2 to 1000

# Sample data: two sale lines a day for August and September 2026.
random.seed(7)
rows, day = [], MONTHS[0][0]
while day <= MONTHS[-1][1]:
    for item in random.sample(list(ITEMS), 2):
        rows.append((day, item, random.randint(1, 12), ITEMS[item]))
    day += timedelta(days=1)

wb = Workbook()
sales = wb.active
sales.title = "Sales"
sales.append(["Date", "Item", "Qty", "Rate", "Amount"])
for r, (d, item, qty, rate) in enumerate(rows, start=2):
    sales.append([d, item, qty, rate, f"=C{r}*D{r}"])
    sales[f"A{r}"].number_format = "DD-MMM-YYYY"
sales.freeze_panes = "A2"
qty_rule = DataValidation(type="whole", operator="between", formula1="1", formula2="500",
                          showErrorMessage=True, error="Qty must be a whole number from 1 to 500")
sales.add_data_validation(qty_rule)
qty_rule.add(f"C2:C{MAX_ROW}")

monthly = wb.create_sheet("Monthly")
monthly.append(["Month", "From", "To", "Qty sold", "Amount"])
for m, (start, end) in enumerate(MONTHS, start=2):
    dates = f"Sales!$A$2:$A${MAX_ROW}"
    when = f'{dates},">="&B{m},{dates},"<="&C{m}'
    monthly.append([start.strftime("%b %Y"), start, end,
                    f"=SUMIFS(Sales!$C$2:$C${MAX_ROW},{when})",
                    f"=SUMIFS(Sales!$E$2:$E${MAX_ROW},{when})"])
    monthly[f"B{m}"].number_format = monthly[f"C{m}"].number_format = "DD-MMM-YYYY"
total_row = len(MONTHS) + 2
monthly.append(["Total", None, None, f"=SUM(D2:D{total_row - 1})", f"=SUM(E2:E{total_row - 1})"])

for sheet in (sales, monthly):
    for cell in sheet[1]:
        cell.font, cell.fill = Font(bold=True), PatternFill("solid", fgColor="DDEBF7")
    for col, width in zip("ABCDE", (14, 20, 10, 10, 12)):
        sheet.column_dimensions[col].width = width

chart = BarChart()
chart.title, chart.y_axis.title = "Sales amount by month", "Amount (Rs)"
chart.add_data(Reference(monthly, min_col=5, min_row=1, max_row=total_row - 1), titles_from_data=True)
chart.set_categories(Reference(monthly, min_col=1, min_row=2, max_row=total_row - 1))
chart.x_axis.delete = chart.y_axis.delete = False              # keep both axes visible in new Excel
monthly.add_chart(chart, "G2")
wb.calculation.fullCalcOnLoad = True                           # Excel works out every formula on open
wb.save(FILE)

# Check: evaluate the saved formulas and redo the same totals in Python.
excel = ExcelCompiler(filename=FILE)
print(f"Saved {FILE}: {len(rows)} sale lines, {rows[0][0]} to {rows[-1][0]}")
print(f"{'Month':<10}{'Qty formula':>13}{'Qty Python':>12}{'Amount formula':>16}{'Amount Python':>15}")
checks = []
for m, (start, end) in enumerate(MONTHS + [(MONTHS[0][0], MONTHS[-1][1])], start=2):
    in_range = [(q, q * rate) for d, _, q, rate in rows if start <= d <= end]
    py_qty, py_amount = sum(q for q, _ in in_range), sum(a for _, a in in_range)
    xl_qty, xl_amount = excel.evaluate(f"Monthly!D{m}"), excel.evaluate(f"Monthly!E{m}")
    checks += [xl_qty == py_qty, xl_amount == py_amount]
    label = excel.evaluate(f"Monthly!A{m}")
    print(f"{label:<10}{xl_qty:>13,}{py_qty:>12,}{xl_amount:>16,}{py_amount:>15,}")
print("All formula totals match Python:", all(checks))