Tennis Analysis Infographic
Evan ONeil
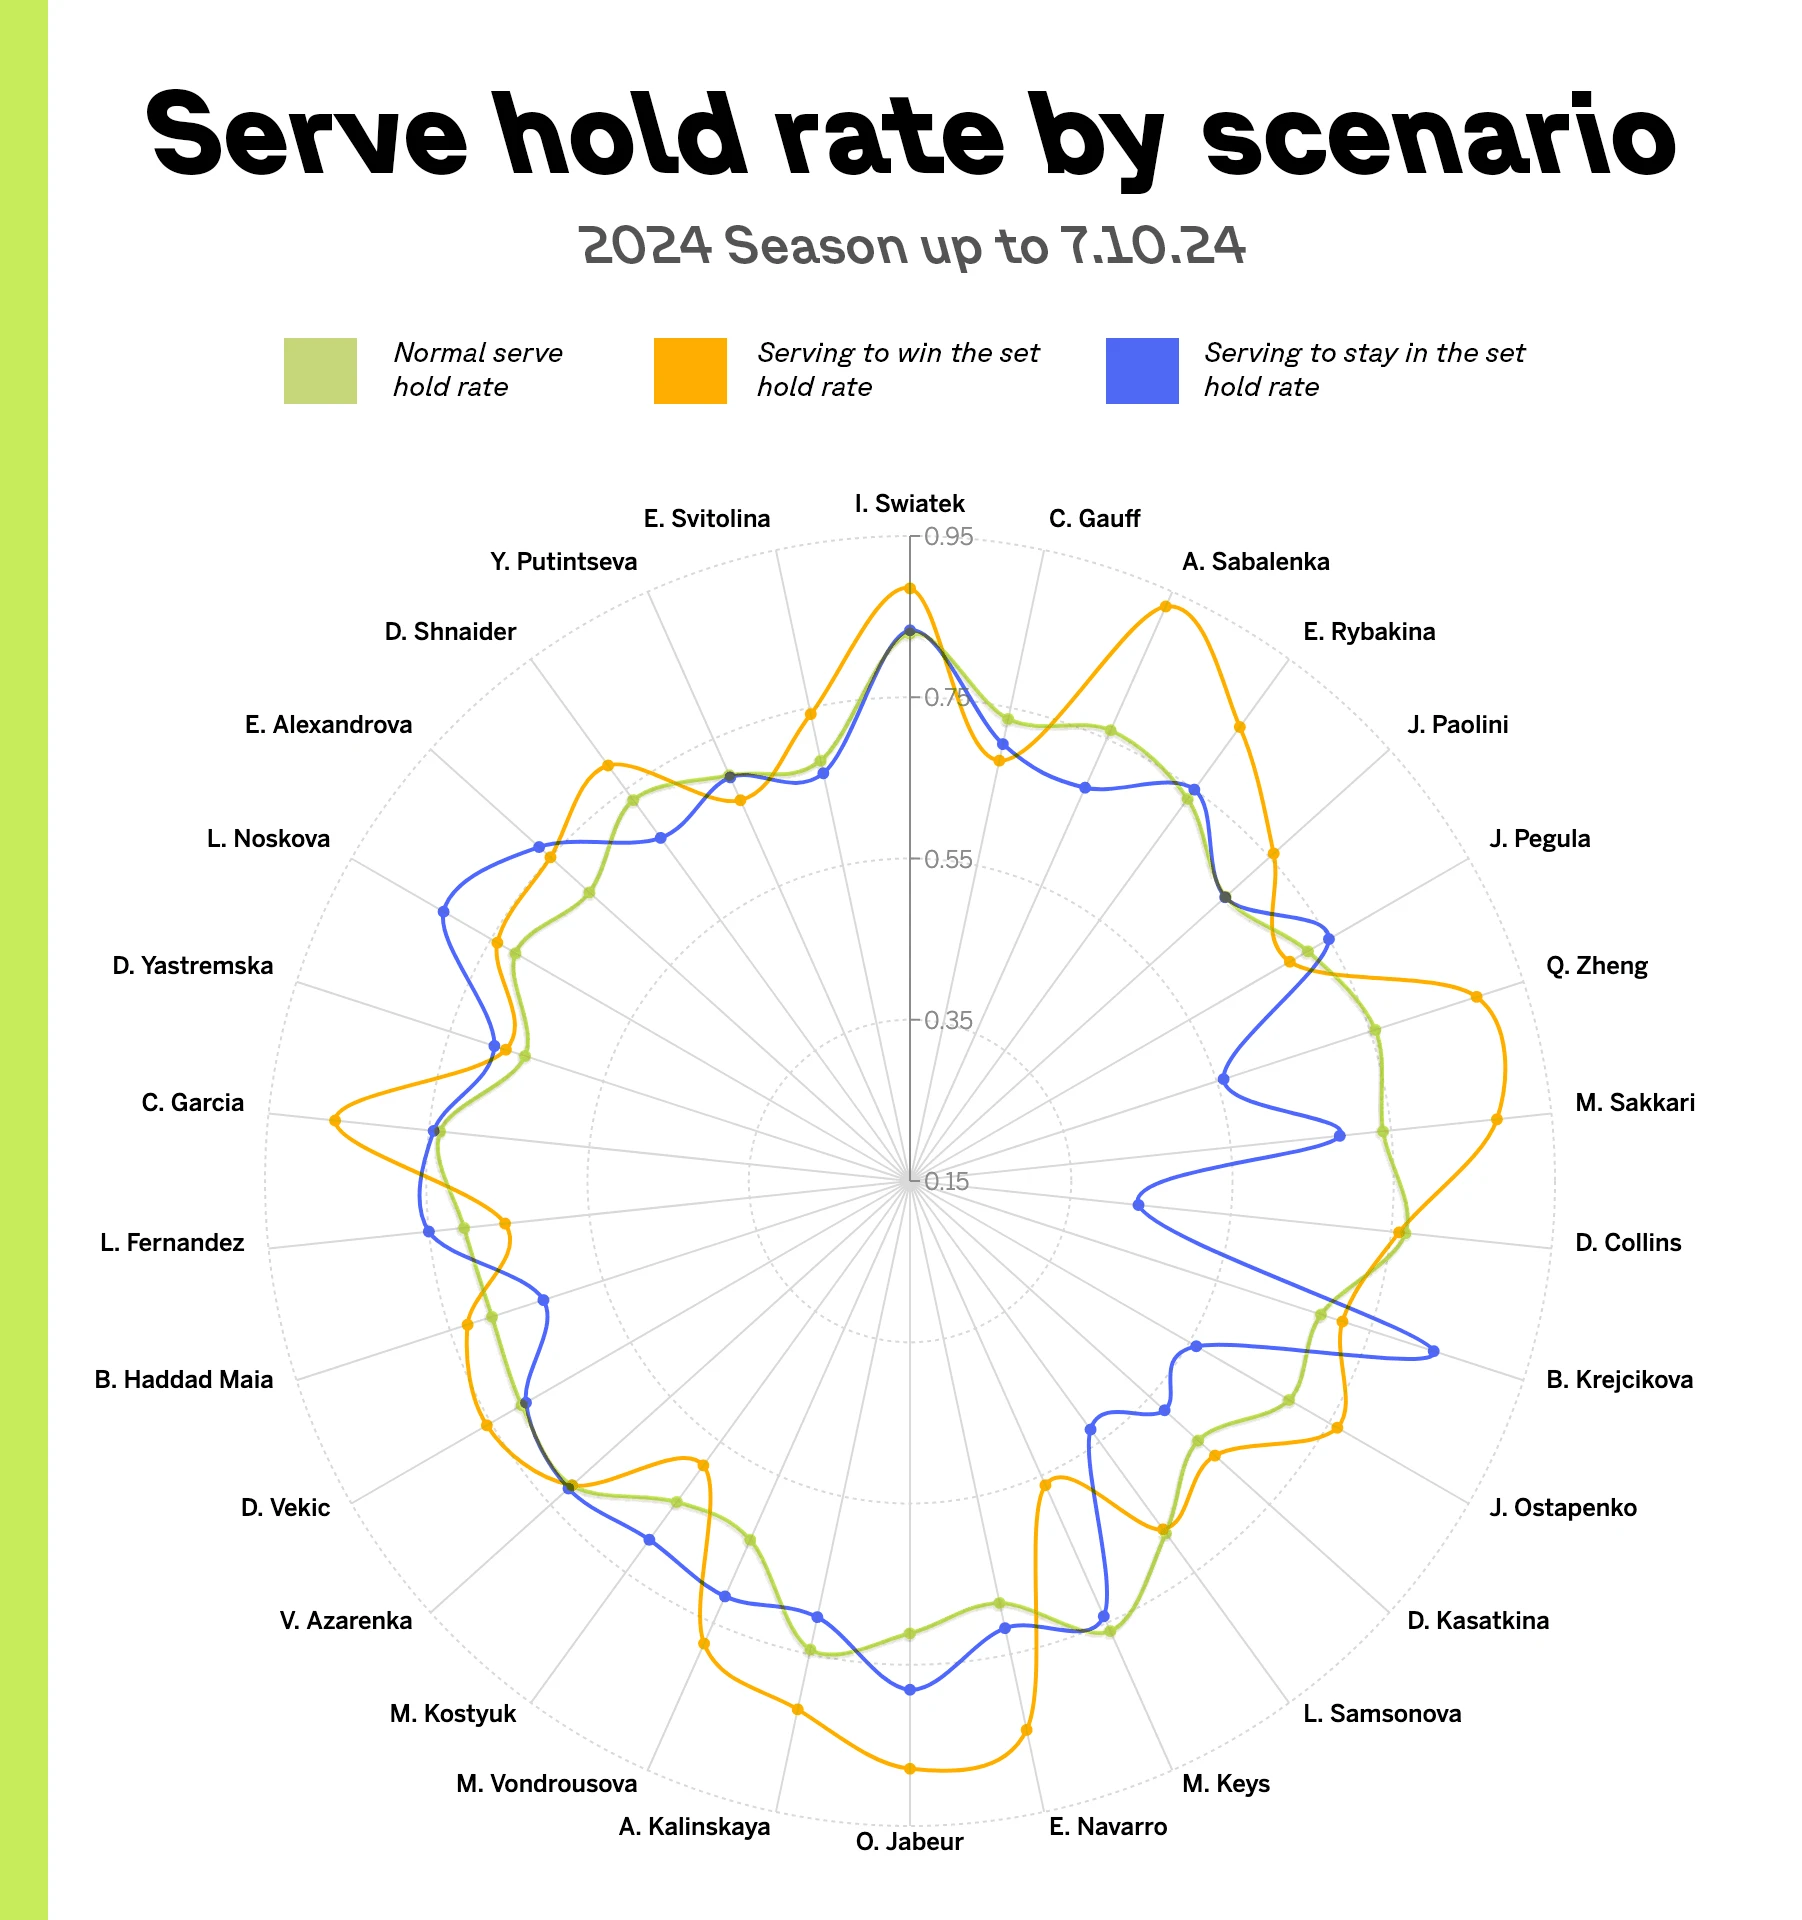
This chart was developed for professional tennis data analysis newsletter called “Sliced Data.” This chart illustrates the top 30 Women’s Tennis Association players' likelihood to win games where they are serving in different situations. A serve hold is the term for when a player wins a game they are serving. A normal service hold is for a game without a direct outcome to the set, serving to with the set is when the player will win the set if they hold serve, and serving to stay in the set is when they will lose the set if they don’t hold serve.
This infographic was developed using R to analyze and explore the data, Tableau to prepare the visualization treatment, and then Adobe Illustrator for final styling and brand application.
Like this project
Posted Jan 8, 2025
A radial chart produced with R, Tableau, and Illustrator to show a professional tennis analysis of serve data.