Impactful Data Visualization & Mapping Expert

Intuitive and Impactful Custom Air Monitoring Dashboard

Interactive map-based dashboard powered by Observable Framework and Mapbox that transforms complex geospatial data into compelling visual insights.

Data Visualizer
Data Analyst
Web Developer
D3.js
Google App Script
Mapbox

Data analysis and Map-based Storytelling for 'The Houston Arrow'

Data analysis and custom interactive map-based storytelling to convey socio-economic conditions in Houston.

Data Visualizer
Data Analyst
Web Developer

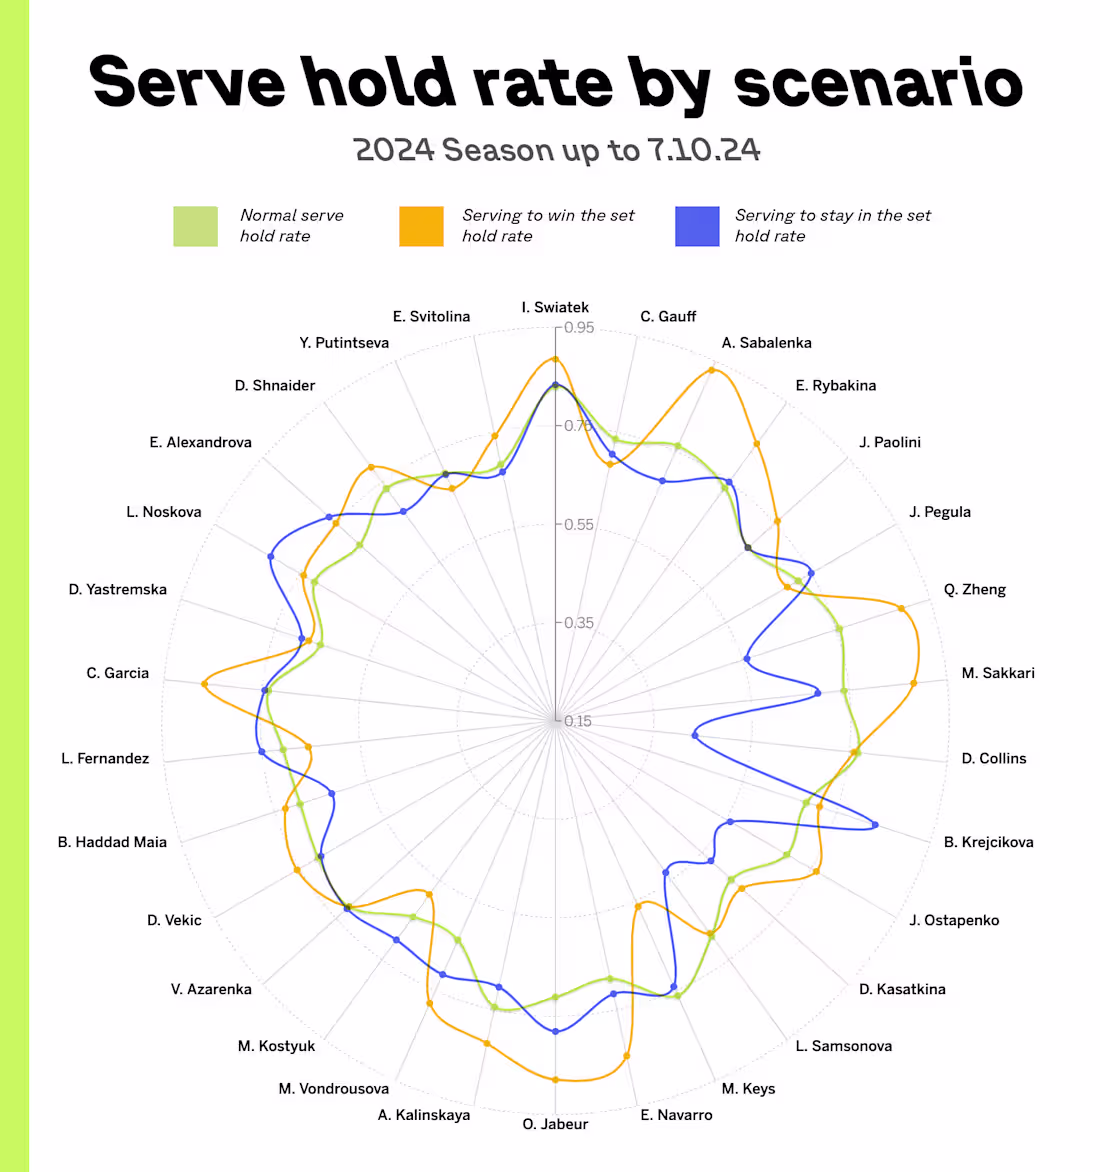
Tennis Analysis Infographic

A radial chart produced with R, Tableau, and Illustrator to show a professional tennis analysis of serve data.

Data Visualizer
Infographic Designer
Data Analyst
Adobe Illustrator
R
Tableau