
Custom GIS Mapping SolutionsEvan ONeil
I transform complex spatial data into clear, actionable geographic insights through custom interactive maps and GIS solutions. Specializing in Mapbox and other leading platforms, I create bespoke visualizations that reveal hidden patterns and relationships in your location data. Whether you need site selection analysis, market targeting, or geographic trend discovery, I deliver intuitive mapping solutions that drive informed business decisions.
What's included
Geospatial data mapping
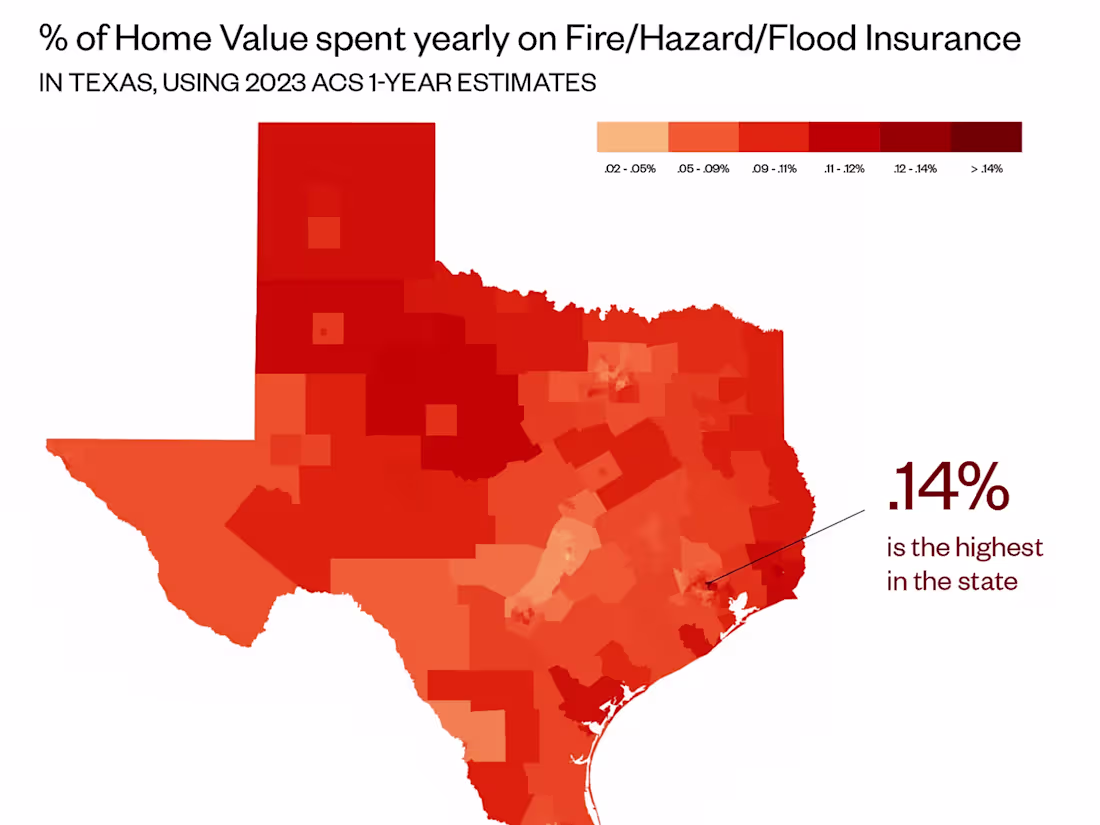
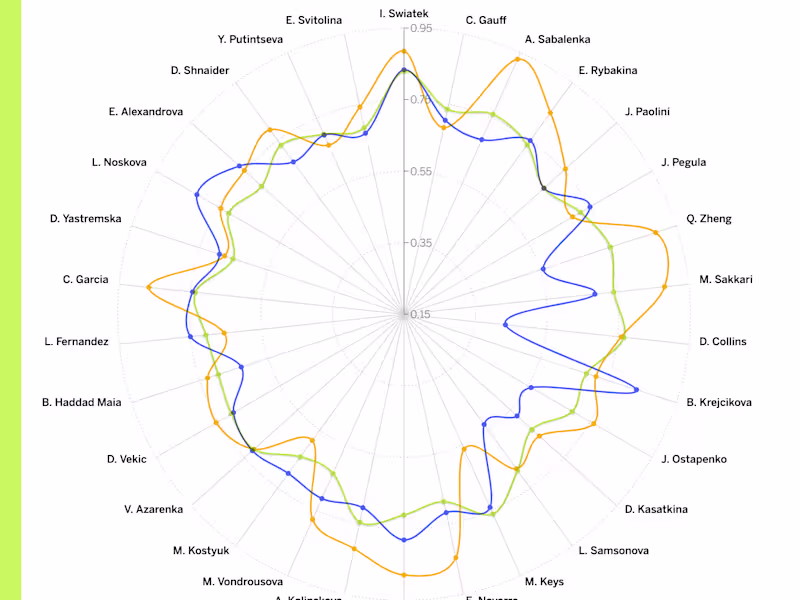
Transform your location-based data into insightful geographic visualizations, including interactive maps, choropleth displays, and spatial analysis. Deliverables include customized maps that highlight patterns, relationships, and trends across regions, compatible with common GIS platforms and web mapping services.
Scrolly-telling interactive map application
I create immersive map-based narratives that guide users through geographic data stories. Using modern web frameworks and mapping libraries (Mapbox GL JS, D3.js), I develop interactive applications where scrolling reveals new map perspectives and data insights. Each project combines: 1) Custom map design and animation 2) Seamless scroll-based interactions 3) Data-driven storytelling that keeps users engaged. Previous work includes voter demographics analysis, climate impact visualization, and urban development stories."
Evan's other services
Starting at$100 /hr
Tags
Adobe Photoshop
Blender
Mapbox
QGIS
Graphic Designer
Infographic Designer
Service provided by
Evan ONeil Houston, USA
Custom GIS Mapping SolutionsEvan ONeil
Starting at$100 /hr
Tags
Adobe Photoshop
Blender
Mapbox
QGIS
Graphic Designer
Infographic Designer
I transform complex spatial data into clear, actionable geographic insights through custom interactive maps and GIS solutions. Specializing in Mapbox and other leading platforms, I create bespoke visualizations that reveal hidden patterns and relationships in your location data. Whether you need site selection analysis, market targeting, or geographic trend discovery, I deliver intuitive mapping solutions that drive informed business decisions.
What's included
Geospatial data mapping
Transform your location-based data into insightful geographic visualizations, including interactive maps, choropleth displays, and spatial analysis. Deliverables include customized maps that highlight patterns, relationships, and trends across regions, compatible with common GIS platforms and web mapping services.
Scrolly-telling interactive map application
I create immersive map-based narratives that guide users through geographic data stories. Using modern web frameworks and mapping libraries (Mapbox GL JS, D3.js), I develop interactive applications where scrolling reveals new map perspectives and data insights. Each project combines: 1) Custom map design and animation 2) Seamless scroll-based interactions 3) Data-driven storytelling that keeps users engaged. Previous work includes voter demographics analysis, climate impact visualization, and urban development stories."
Evan's other services
$100 /hr