Agrotech Dashboard

Cansaas Agency


Overview
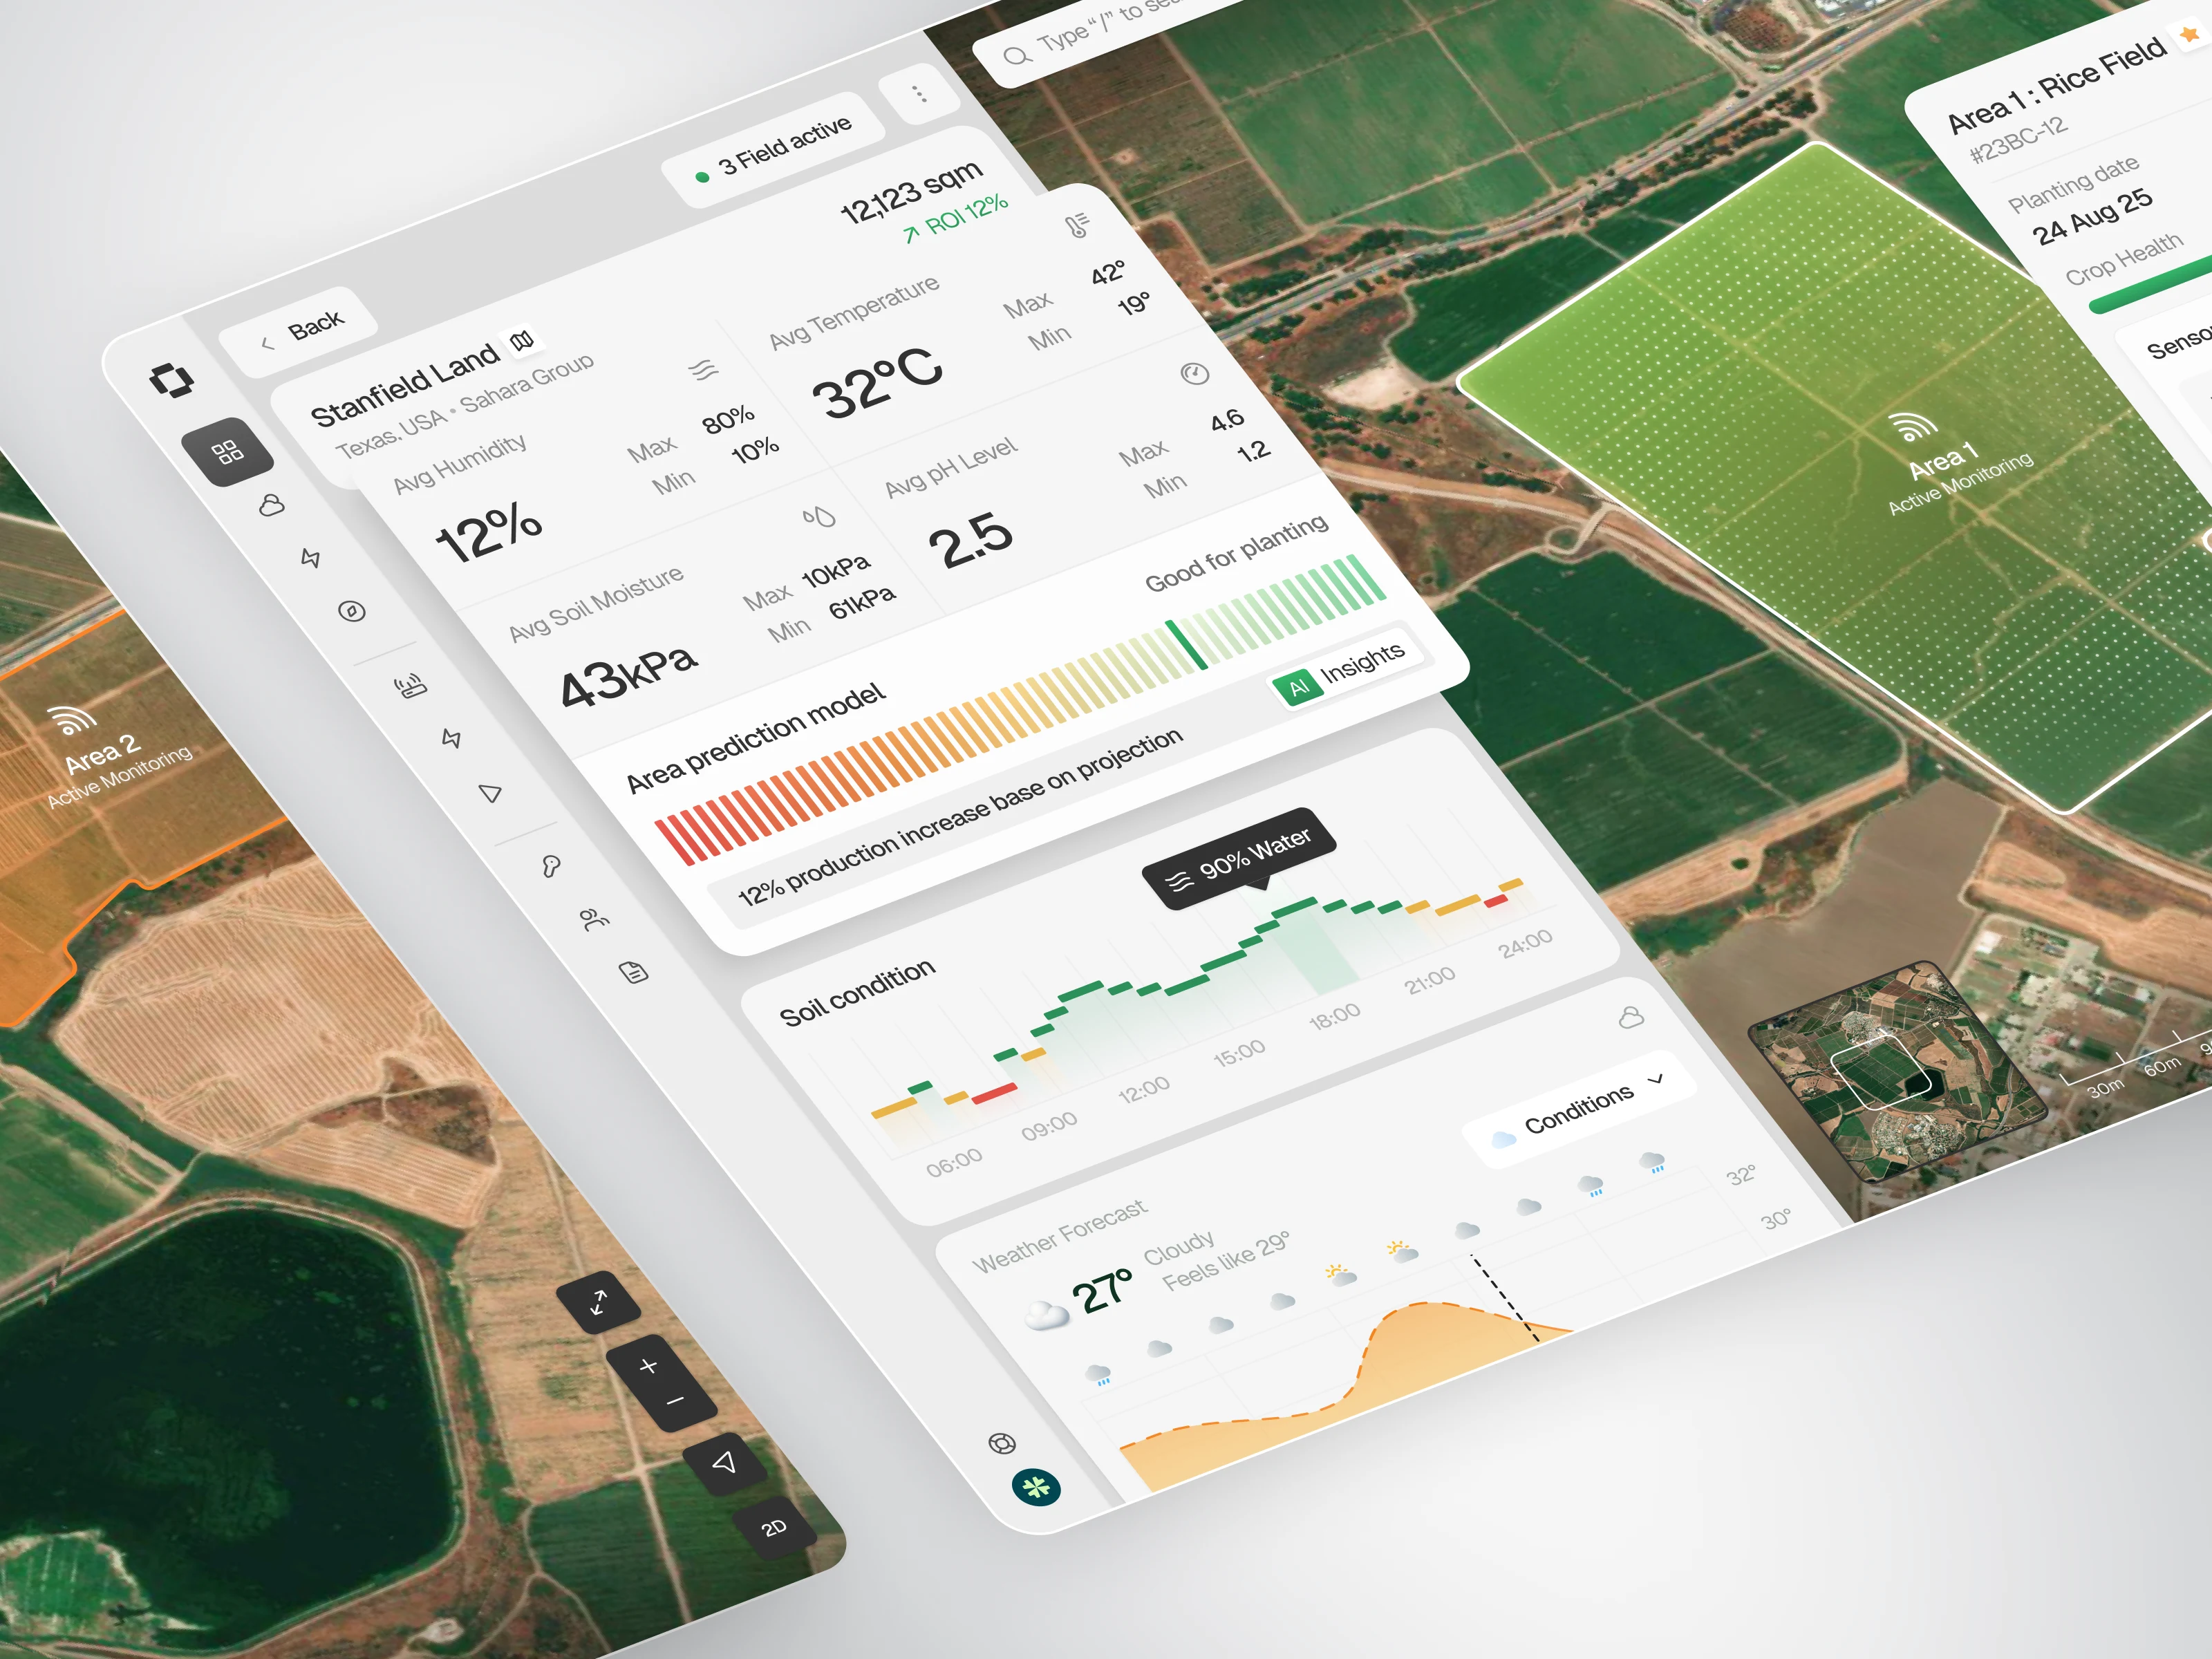
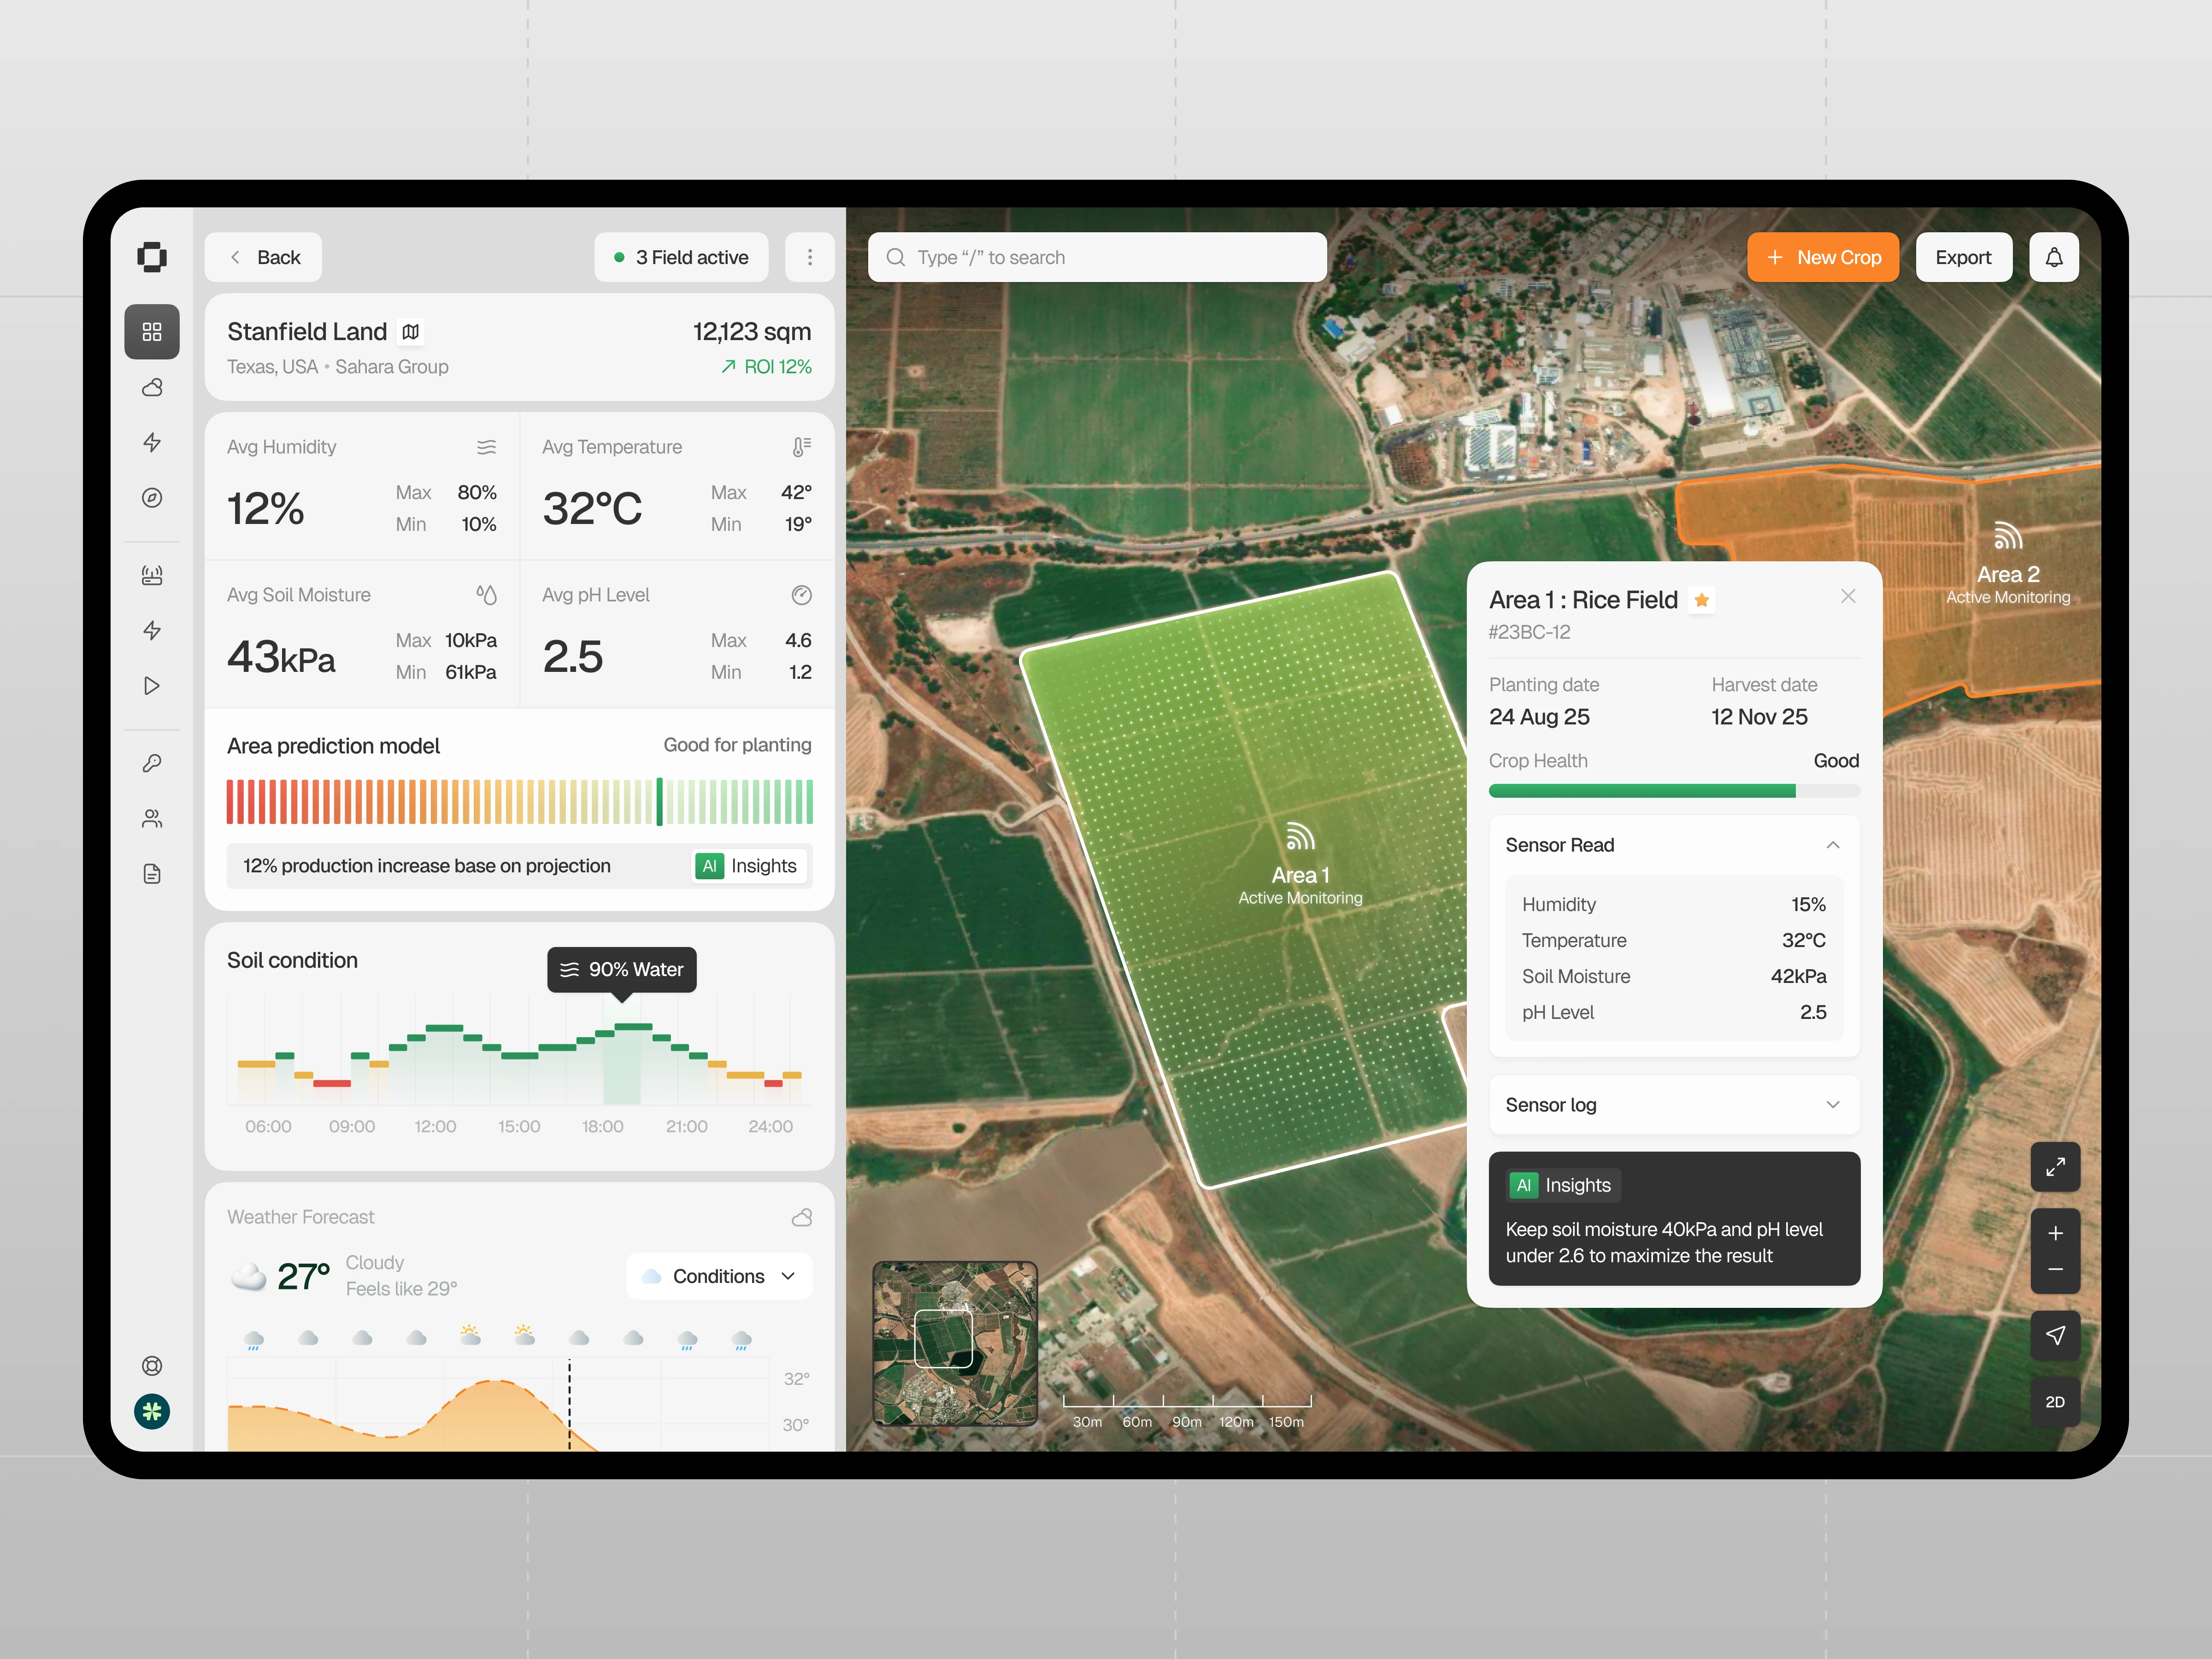
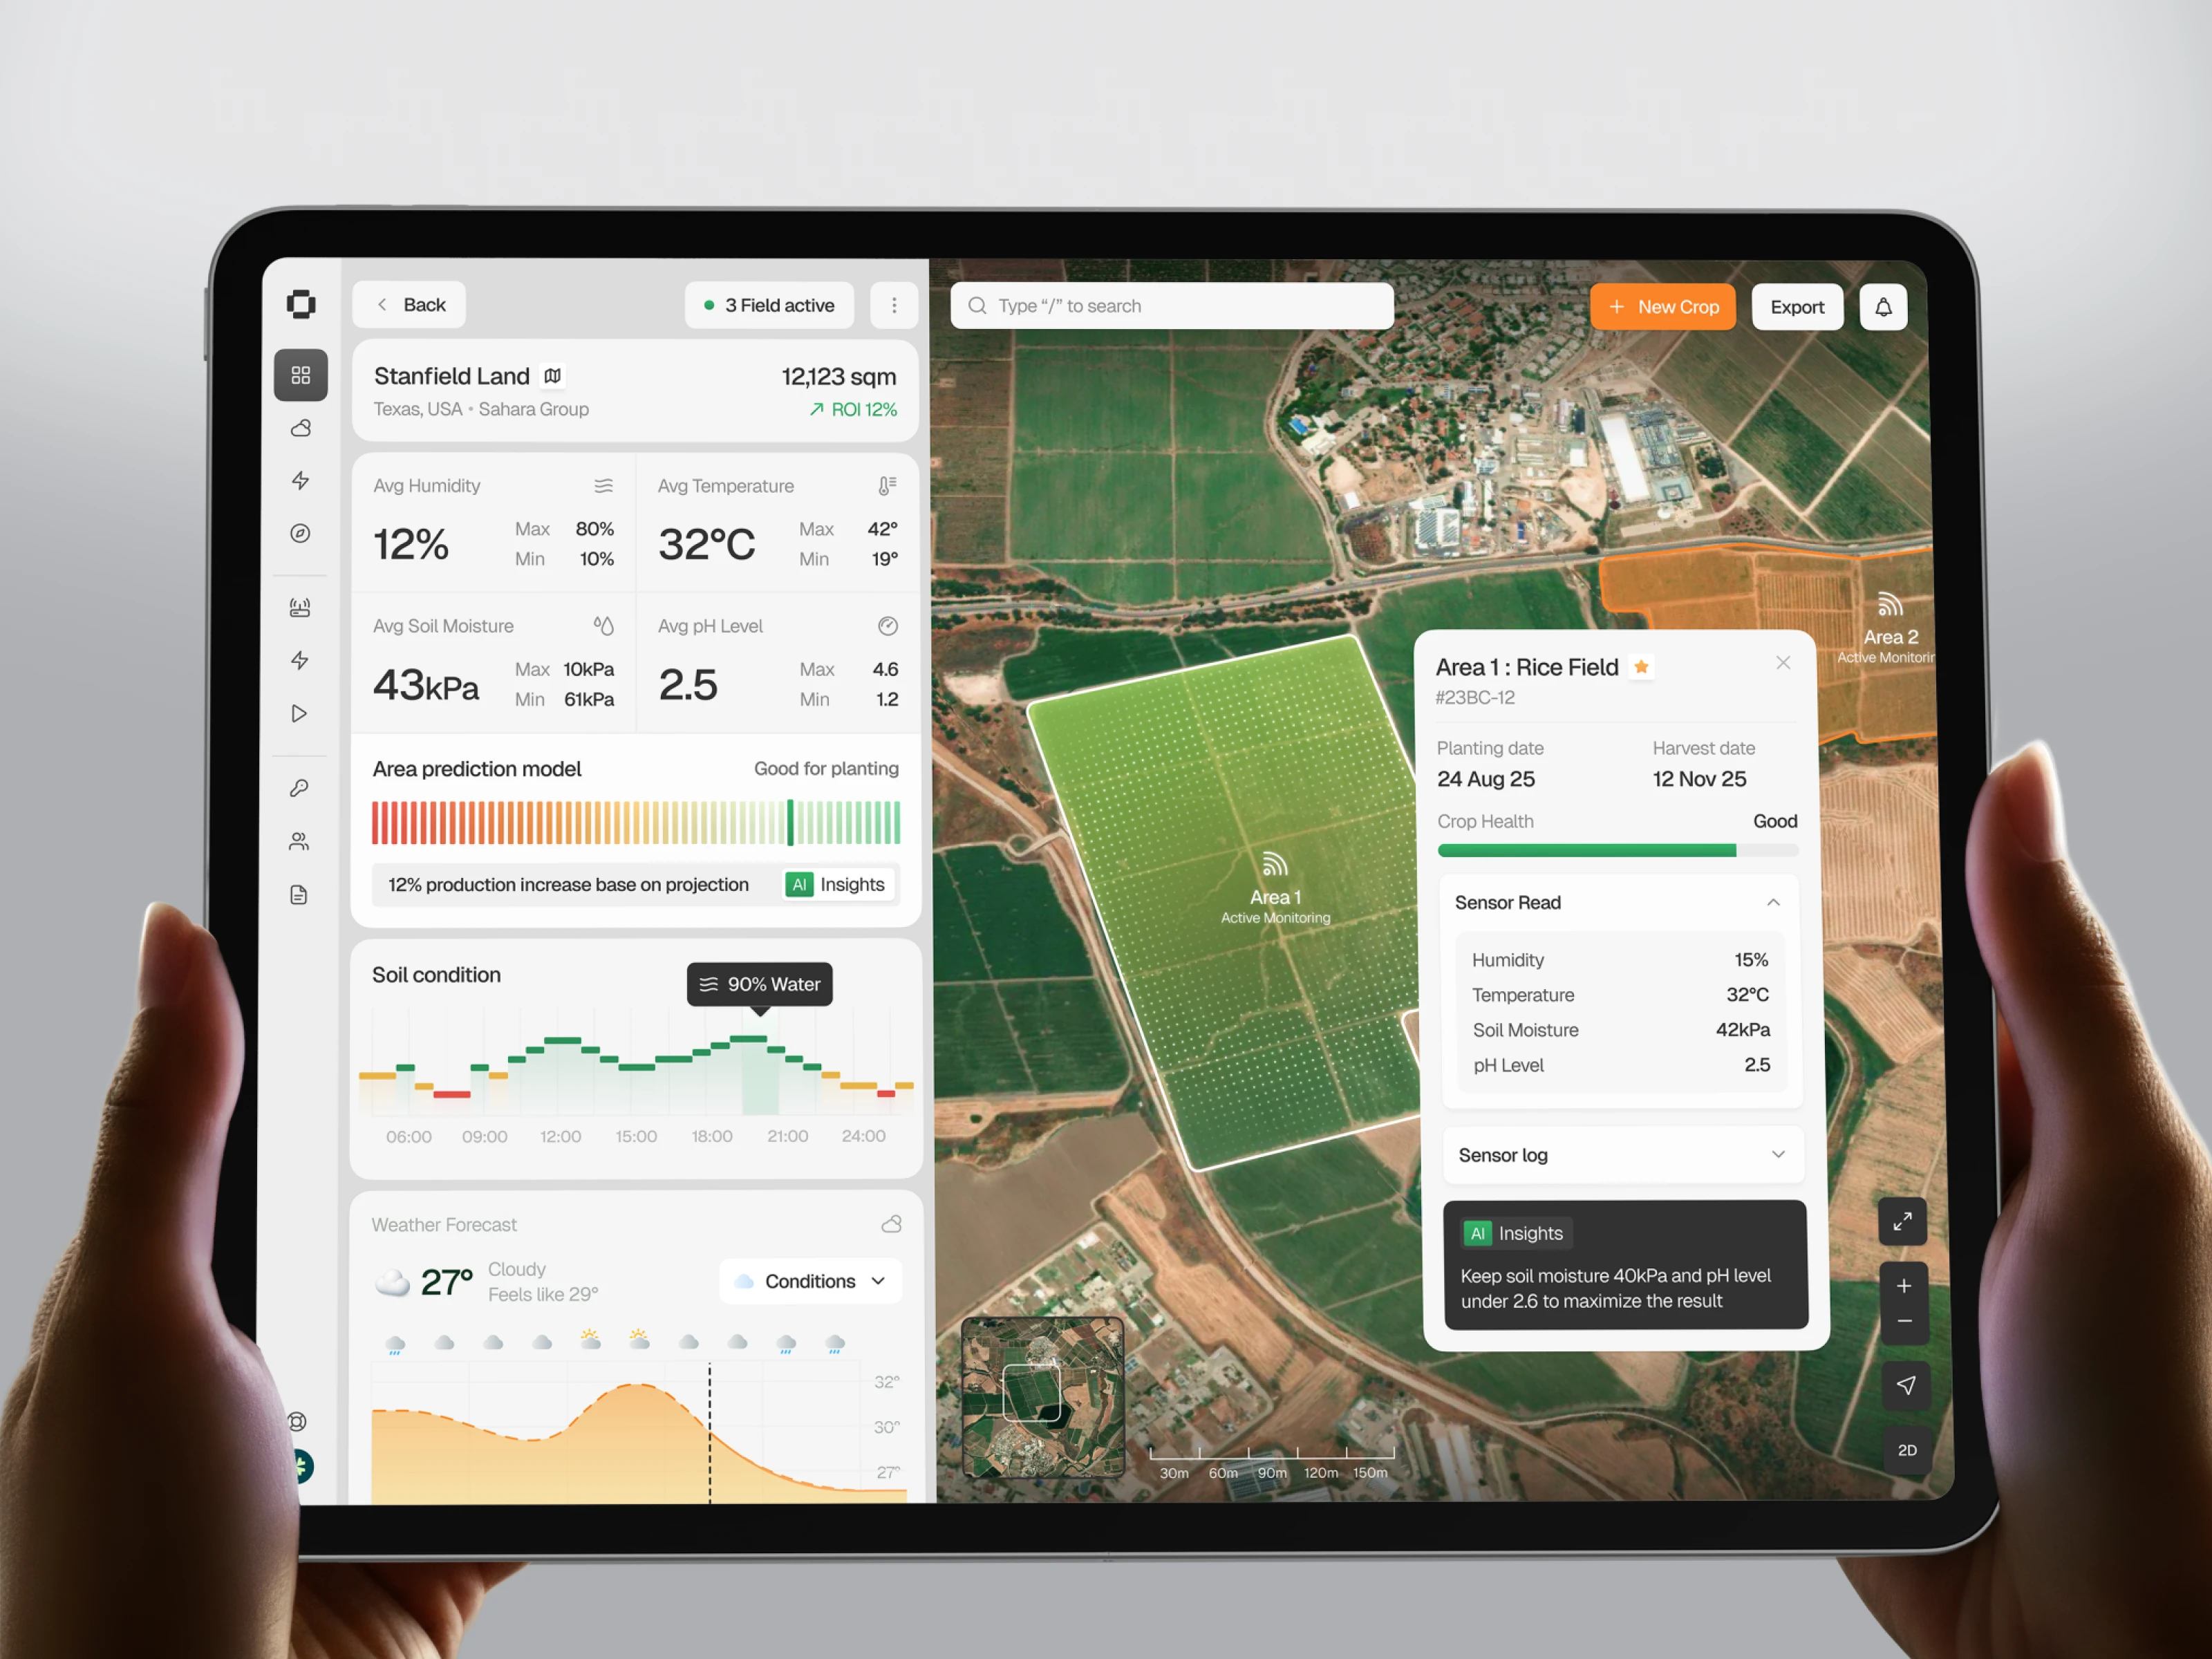
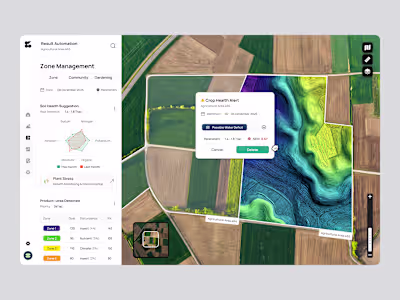
This Agrotech Dashboard concept presents a modern approach to land and crop monitoring by combining real-time satellite imagery with structured environmental data. The interface introduces a balanced split-view layout: analytical metrics on the left panel and an interactive field map on the right. Through this arrangement, users can move effortlessly between high-level insights and detailed field conditions, enabling a clear understanding of farm performance at any scale.
The Problem
Agricultural teams often work with fragmented systems that separately track soil moisture, humidity, temperature, pH levels, weather patterns, and crop health. This lack of consolidation makes it difficult to evaluate conditions quickly or identify early signs of risk. Without a unified view, decision-making becomes slower, and opportunities to optimize crop growth or prevent issues can be missed.
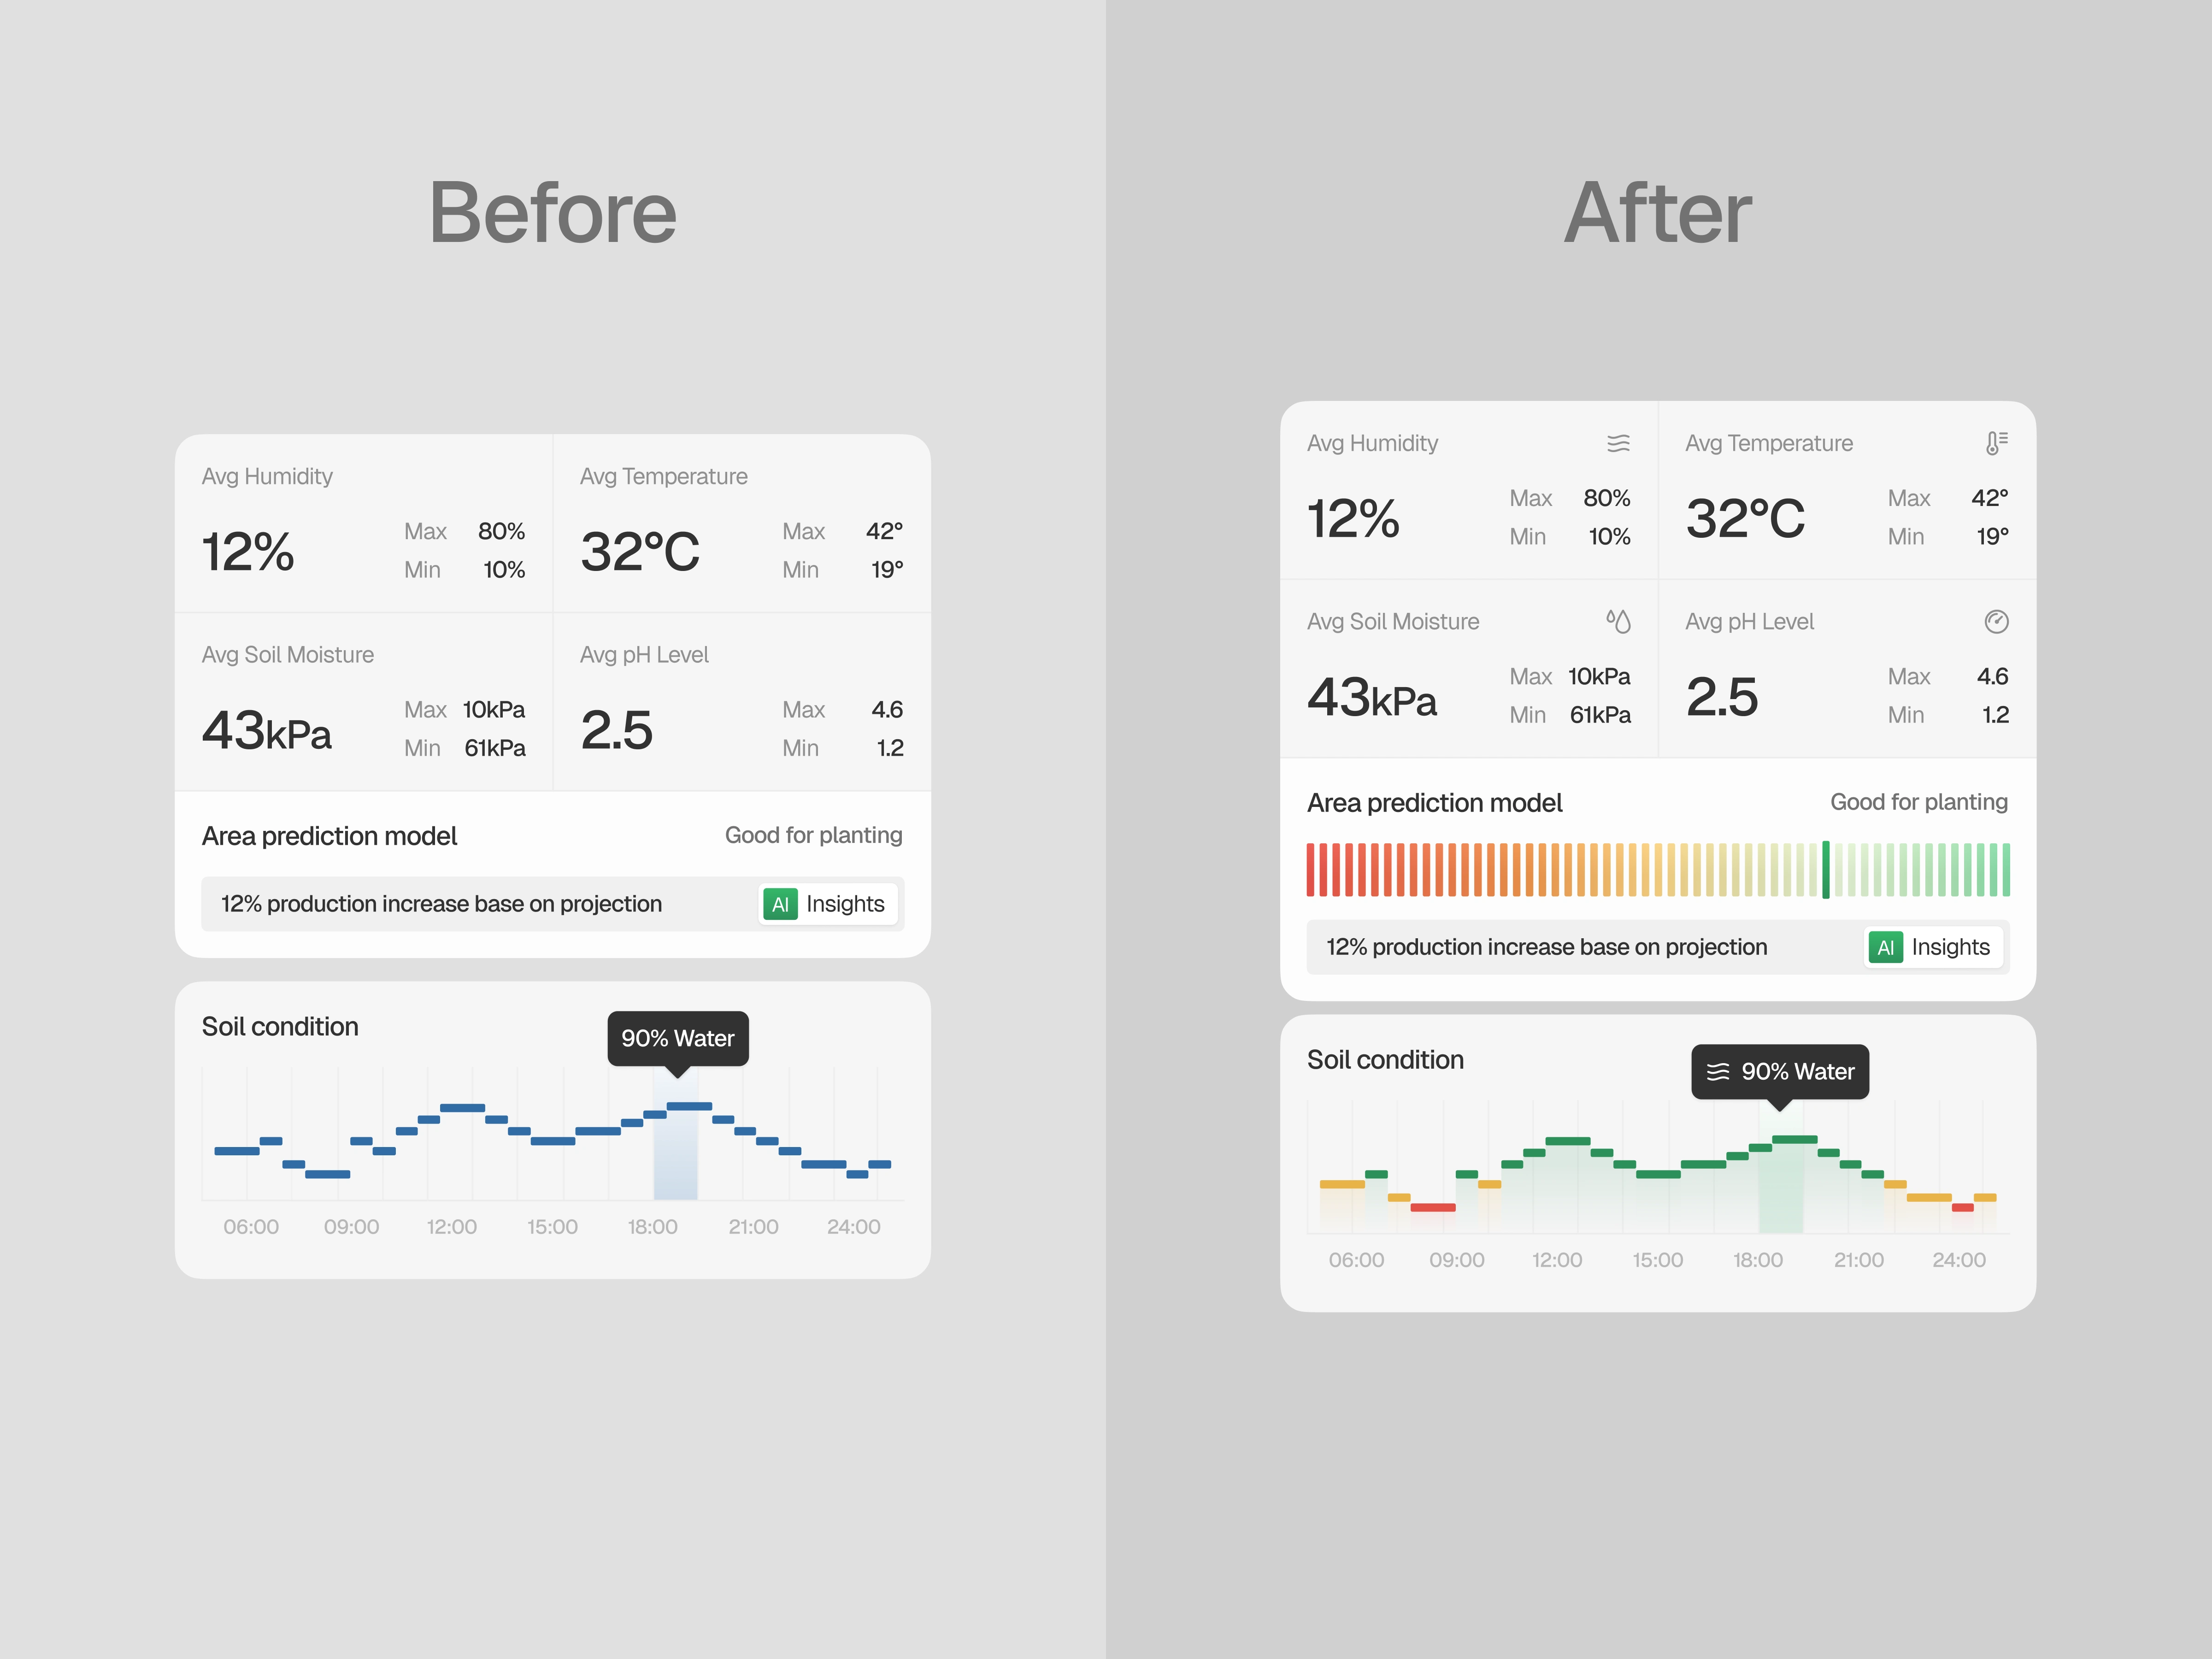
Color for State, Meaning, and Fast Recognition
Color is a powerful tool in directing user attention, building visual hierarchies, and indicating system status (for example, red for warnings, green for success) (src: nngroup.com)
One such application is seen in the improved element in the right, using visualization could help user understand quickly meaning or information that want to deliver. Also using right color help user to identify the state or the condition from an information.
The Solution & Impact
This dashboard simplifies agricultural monitoring into a unified, intuitive interface. Users can track planting and harvest timelines, interpret soil condition charts, and assess field performance without switching between tools. The combination of analytical visuals and live mapping enables more informed and timely decisions. By delivering clear, real-time awareness of each field’s health, the dashboard ultimately supports higher productivity, better resource allocation, and a more confident approach to precision farming.
Like this project
Posted Nov 20, 2025
In this exploration, I reimagined field data by merging satellite maps, soil metrics, weather info, and sensor readings into one clean split-view interface.


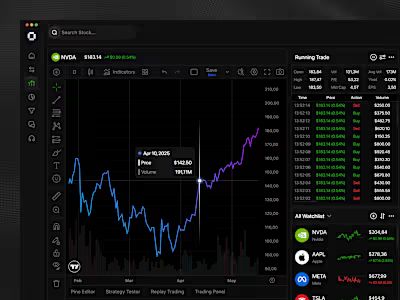
Stock Investment Dashboard
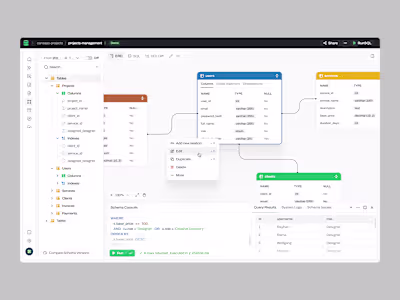
Database Management Dashboard
Agrotech Dashboard
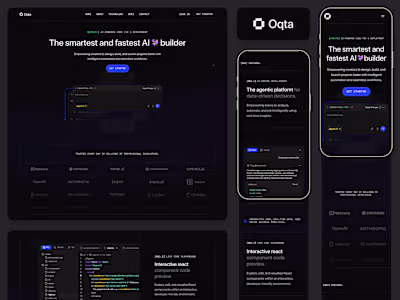
Oqta - AI Builder Responsive Landing Page