Agrotech Dashboard
Cansaas Agency
Overview
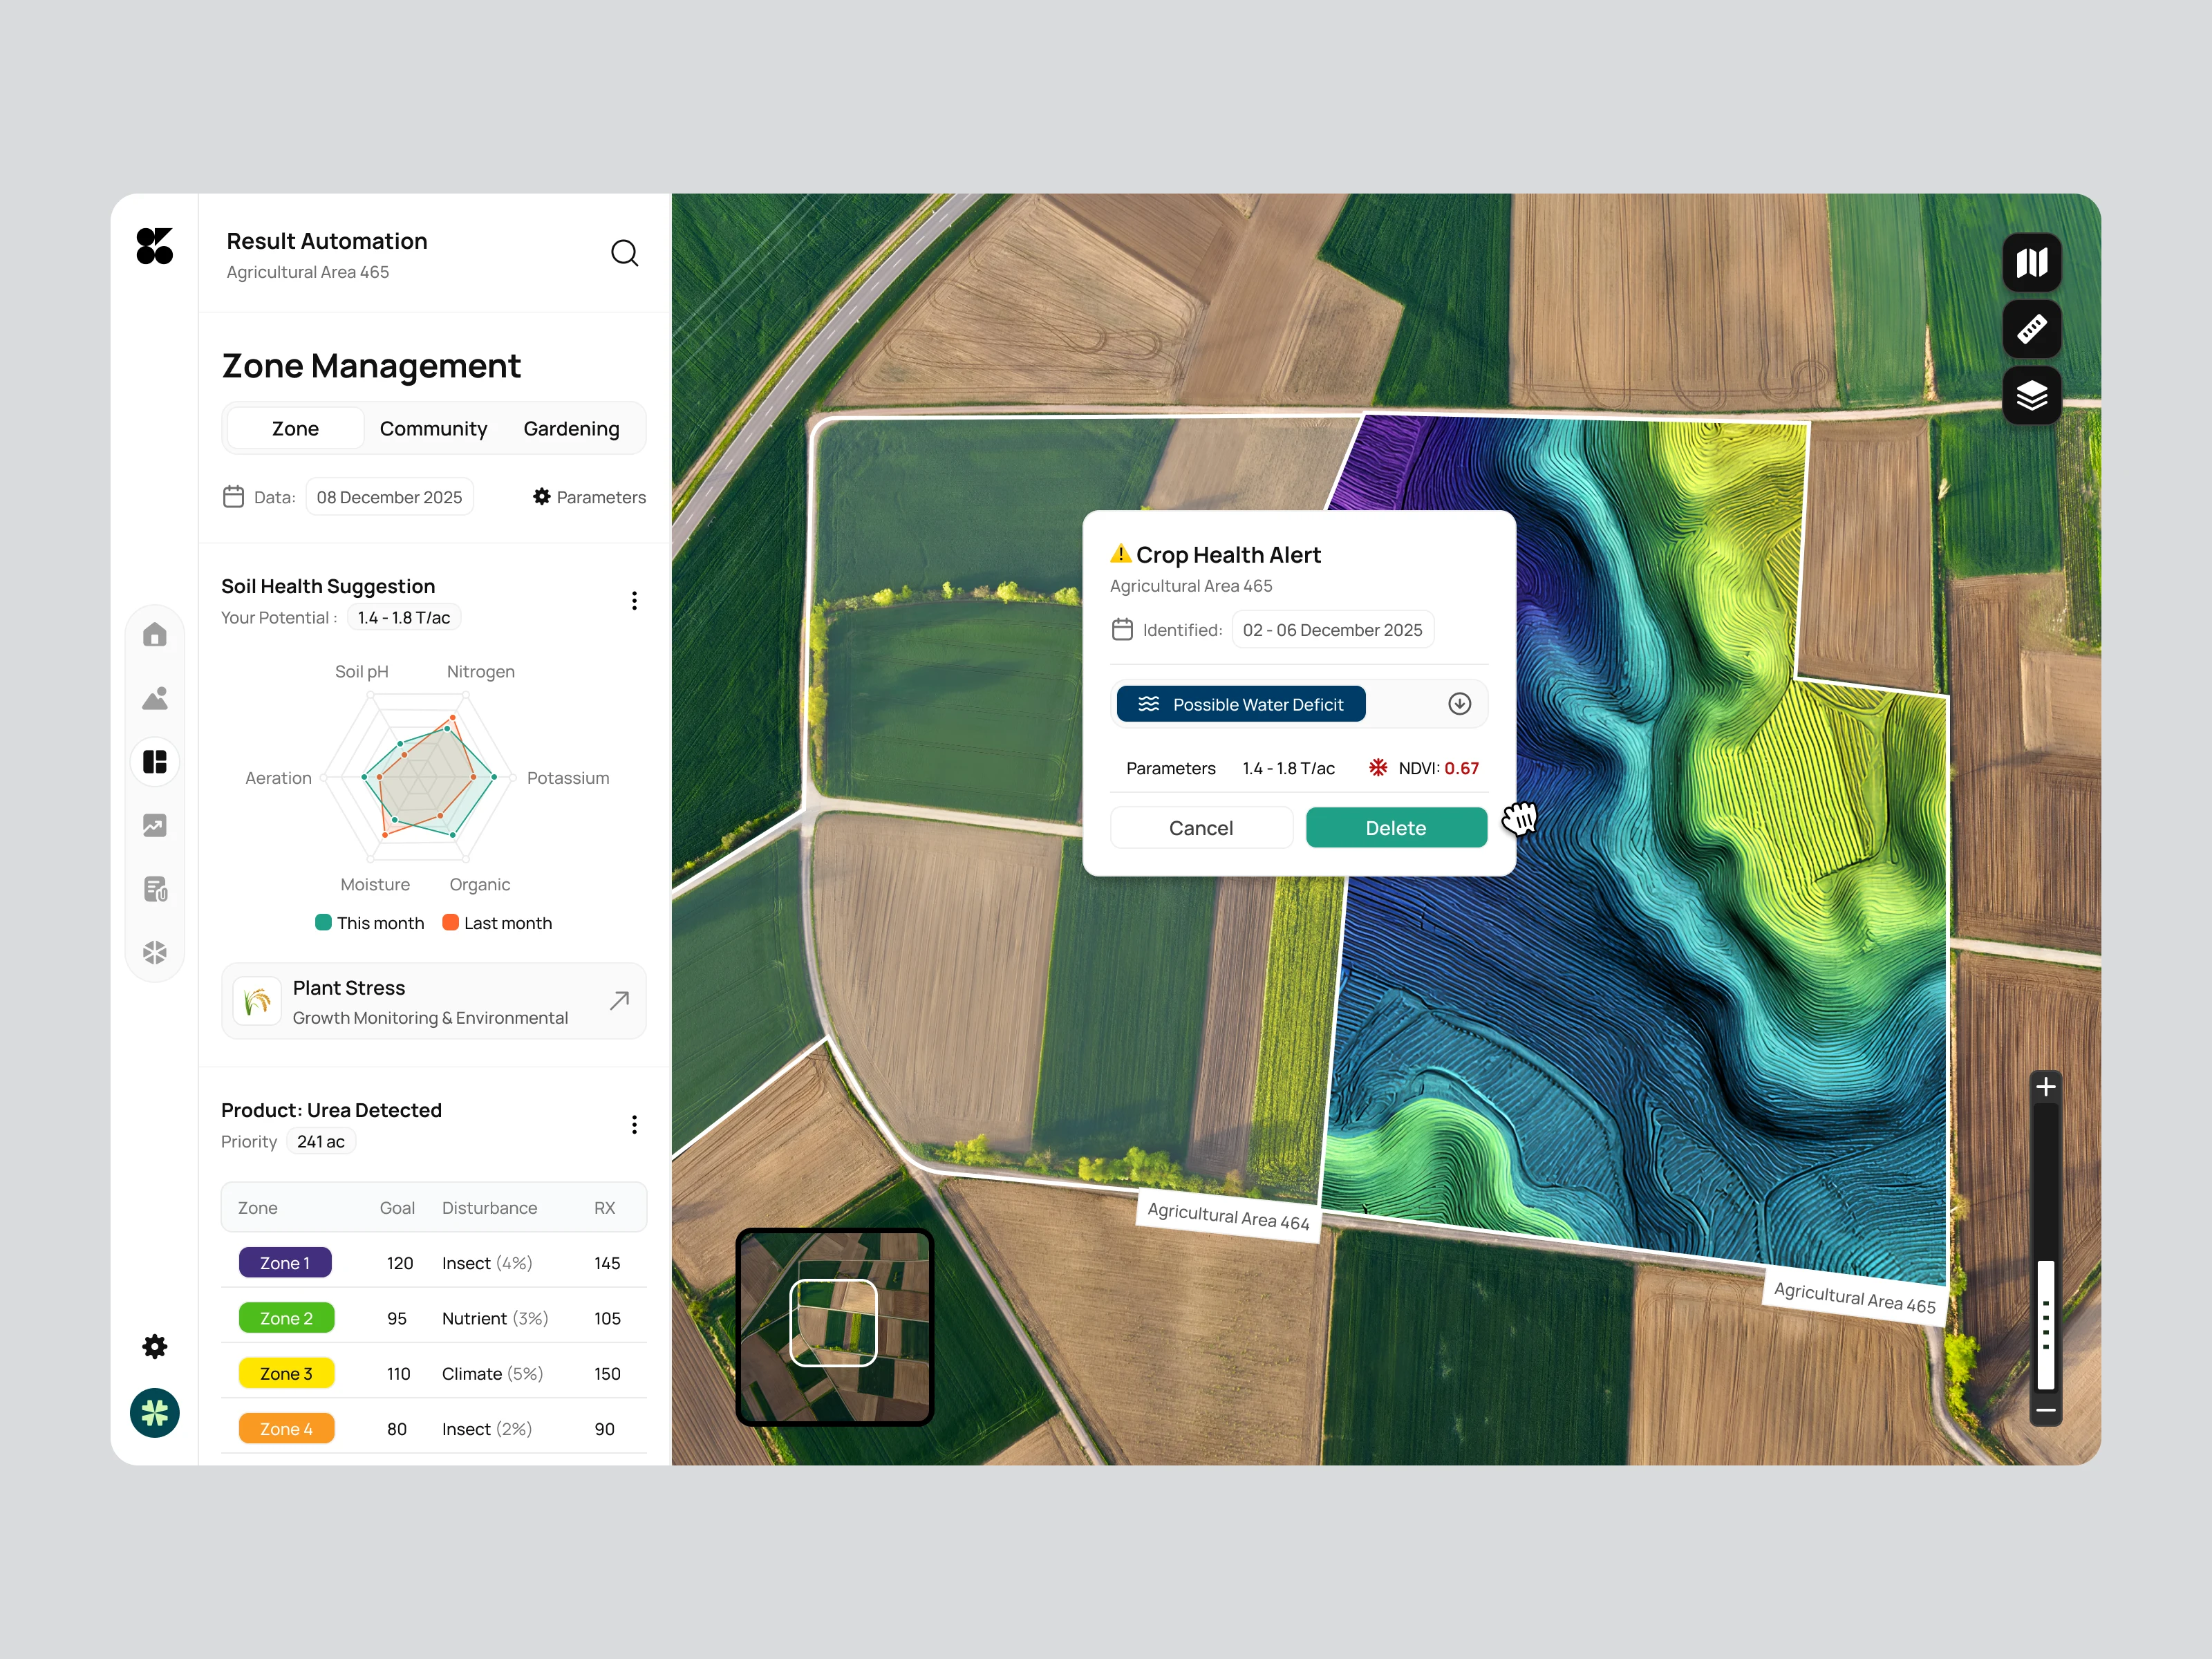
This Agrotech Dashboard is designed to help farmers, agronomists, and agricultural analysts understand field conditions through a powerful combination of geospatial visualization and soil-health analytics. The interface blends high-resolution agricultural maps with structured data panels, enabling users to explore crop performance, stress indicators, and environmental deviations in real time. The layout uses a calm, modern aesthetic, ensuring that complex agricultural metrics are easy to interpret at a glance.
The Problem
Traditional agricultural monitoring tools often present data in fragmented, hard-to-read formats. Soil metrics, NDVI readings, zone disturbances, and climate patterns are typically scattered across separate pages, making it difficult for users to connect insights and act quickly. Farmers need a centralized platform that can visualize conditions clearly while reducing the complexity of analyzing satellite data and field health parameters.
The Solution
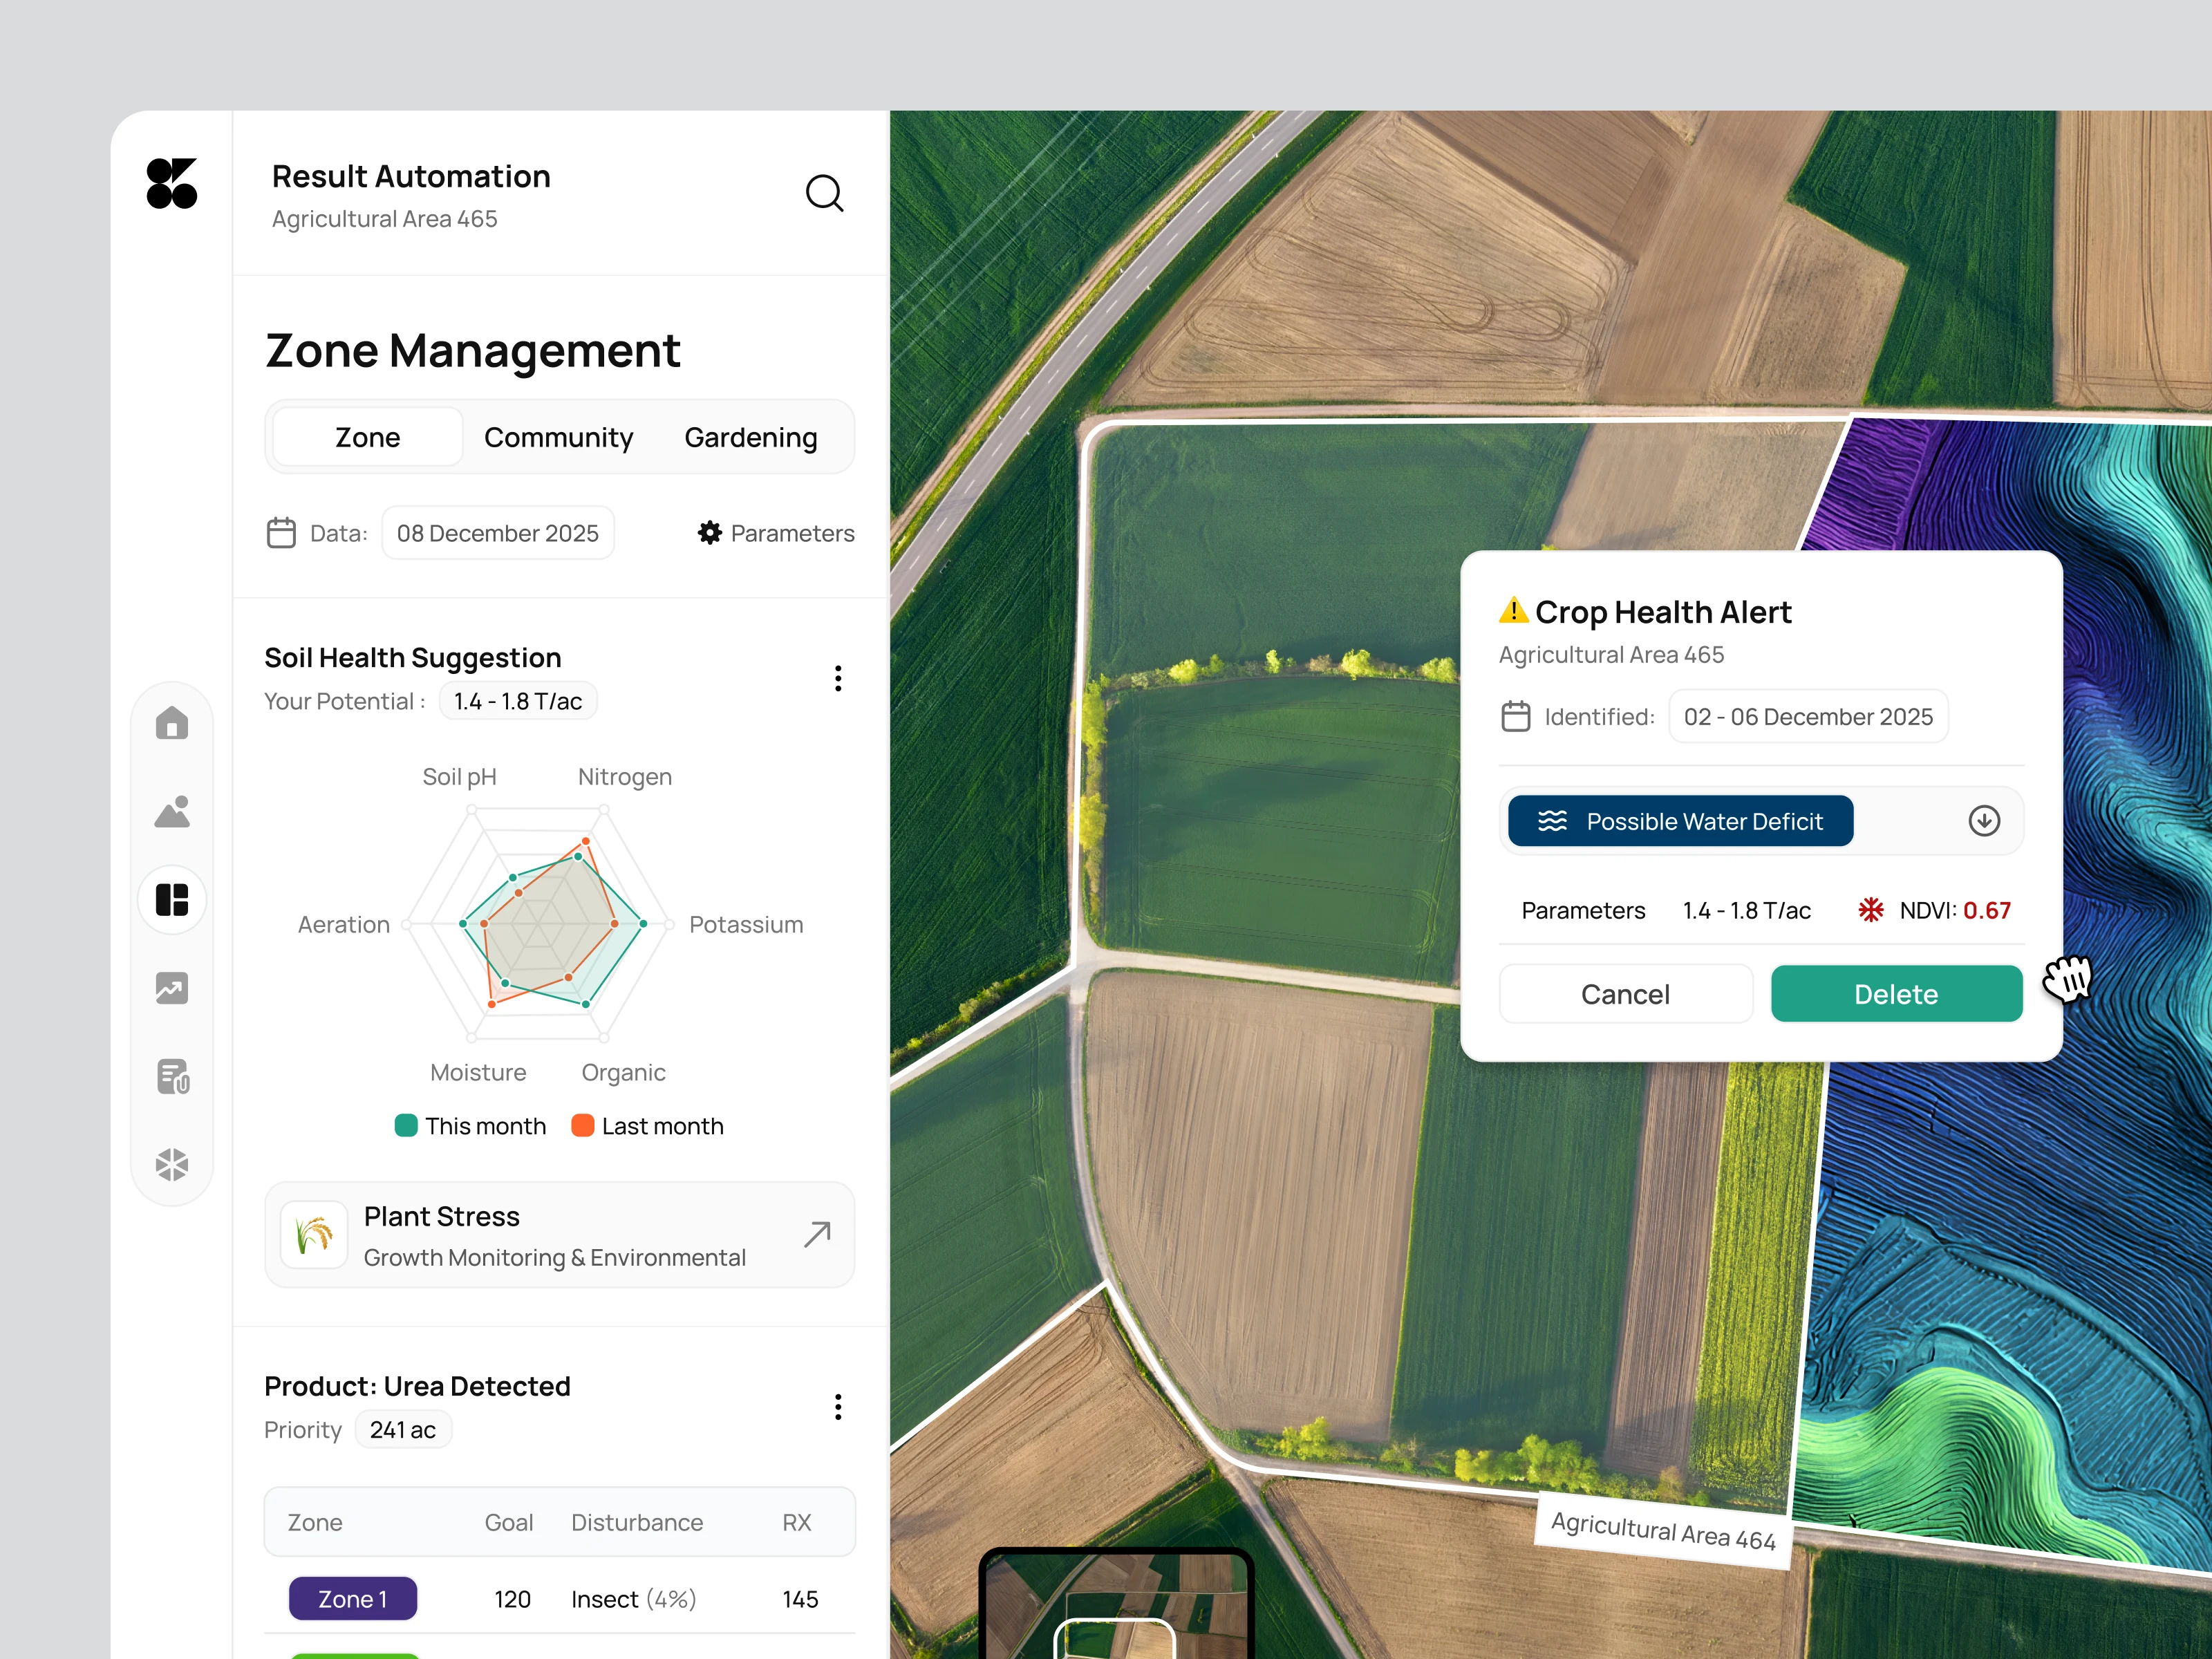
This dashboard integrates soil analytics, satellite-based mapping, and zone-level insights into a cohesive environment. The left panel provides structured information such as soil balance charts, plant stress categories, detected substances, and monthly comparisons. On the right, a dynamic geospatial map visualizes terrain gradients, NDVI values, and crop alerts, allowing users to pinpoint issues with visual precision. The unified layout makes the relationship between data and land immediately clear, helping users evaluate conditions without switching screens.
The Impact
By merging scientific data with intuitive mapping, the dashboard significantly improves decision-making speed and accuracy for agricultural operations. Users can detect anomalies faster, assess the severity of crop stress, prioritize zones based on disturbances, and understand environmental changes through layered visual cues. This clarity reduces guesswork, enhances crop protection strategies, and increases overall field productivity.
Like this project
Posted Nov 17, 2025
In this concept, I reimagined how agricultural data comes to life by merging soil analytics, crop alerts, and NDVI insights into a sharp map-driven interface.