District Brief Visualization — Turning Data Into Action

Scott DS Young



The problem/starting point
Original District Brief → your interpretation → final direction
Showing the original alongside your early/final exploration is enough to establish the transformation. You don't need to explain every concept.
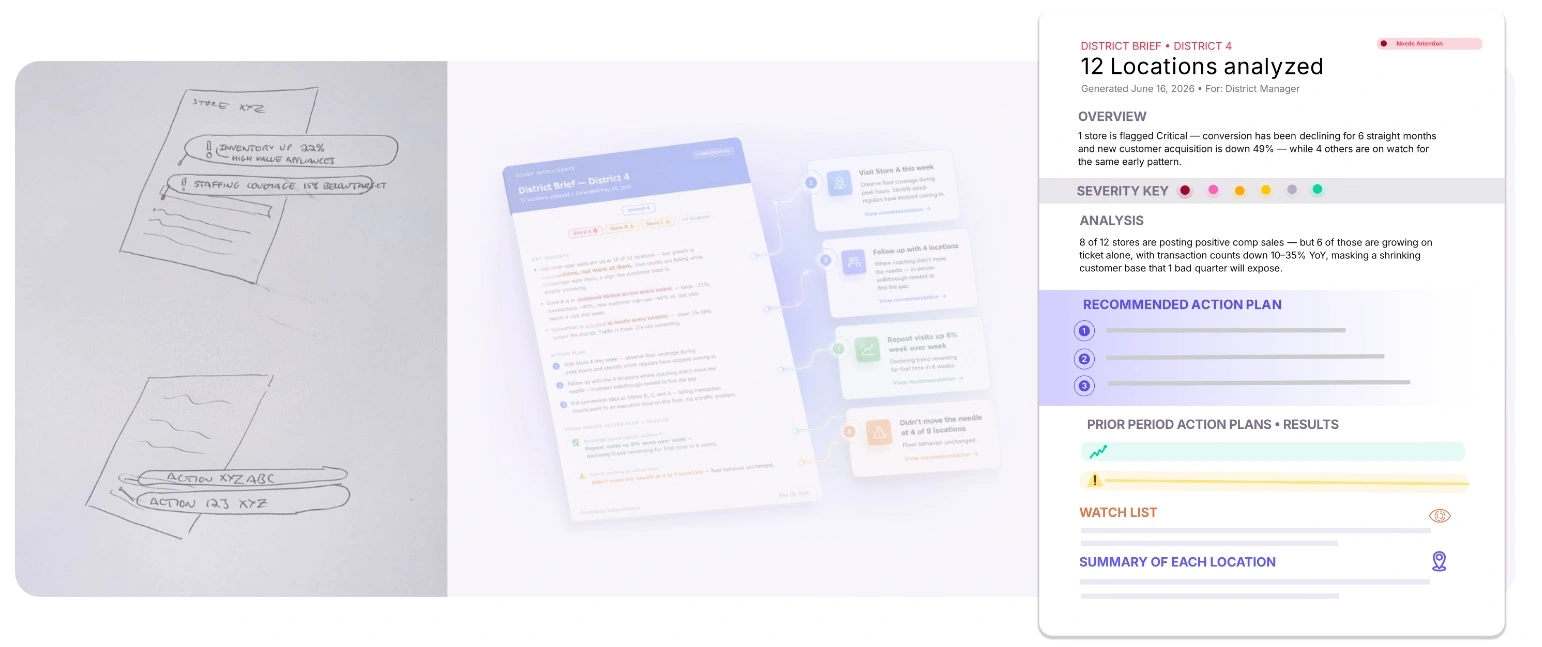
The visual system
I developed a visual system that transforms the District Brief into a more dynamic experience, combining perspective, typography, UI components, connector lines, and floating callouts to surface key insights and actions.
The system was designed to make complex performance data easier to scan, understand, and act on.
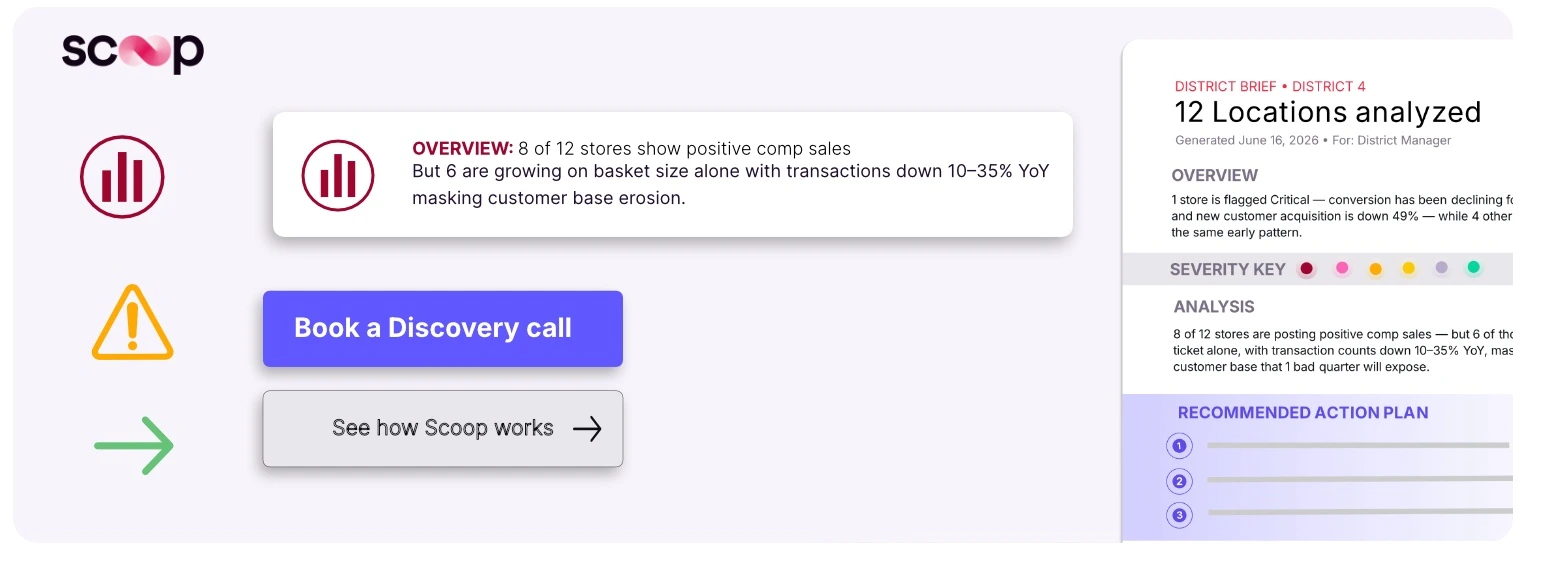
Typography | UI components: connector lines
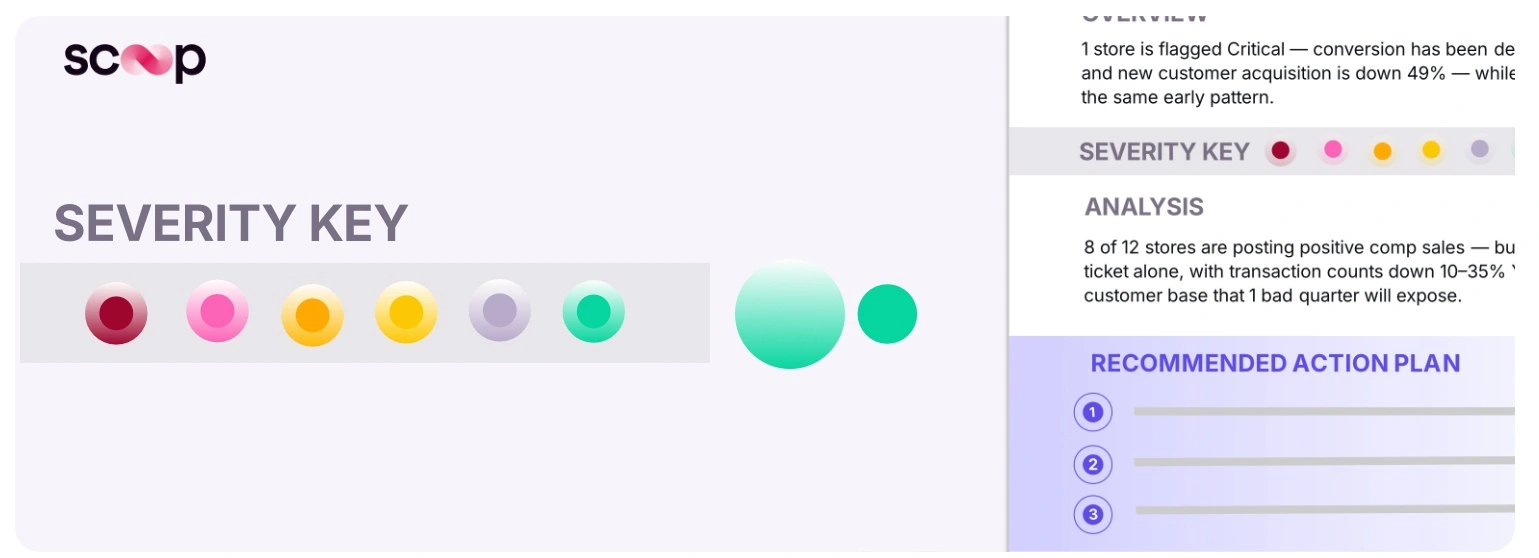
Other reusable visual elements

Perspective treatment | callout/action elements
District Brief Visualization — From Data to Insight
Transformed a static District Brief into a dynamic visual system, using perspective, alerts, and action callouts to turn performance data into clear next steps.

Final Delievable
Like this project
Posted Aug 12, 2026
Transformed a static District Brief into a dynamic visual system, using perspective, alerts, and action callouts to turn performance data into clear next steps.
Likes
0
Views
14
Timeline
Jun 2, 2026 - Jun 19, 2026