SME SaaS Dashboard Builder
Mohammad Adineh
Verified
reporting.dev Dashboard builder -- inserting chart + kpi widgets to publish
Intro
reporting.dev is a low-code app helping small SaaS founders streamline and fast-forward their product development process by letting them create their dashboards easily using a drag-and-drop dashboard builder.
Quick Recap
What it is: A low-code web app for building live dashboards.
Who it’s for: Non-tech founders, tiny teams, and overloaded startup PMs.
My role: Ran the entire design show—research, UX, UI, design system, and hand-off.
Audience
Non-techy founders who are looking to build a simple dashboard for their physical/digital product
Small founders looking to build an MVP as quickly as possible
Startups that are looking to build internal dashboards without any hassle
Research
Problem validation – Got access to data and insights gathered by the founding team, performing research validating the idea.
Idea testing – User flows → quick wireframes → internal testing.
Quick wireframing and testing the idea + spotting edgecases
Design
We took rough wireframes through iterative prototypes, layering in data connections, state logic, and accessibility rules until they became a polished app—visually clean on the surface yet driven by a feature-rich engine below.
Features
Unified Widget Library – one tab with every chart, table, KPI card, and text block, plus instant theme switching. All categorized
Action Widgets – buttons, filters, and date pickers to make the dashboards as interactive as possible for end users.
Saved Widgets – tweak a widget once, save it, and drop that tuned version anywhere.
Global Variables – define a metric or date range once; reuse it across dashboards and auto-update everywhere.
Canvas Settings – one-click controls for background, primary color, padding, fonts, borders—designer candy.
Dashboards -- manage all the dashboards in one place
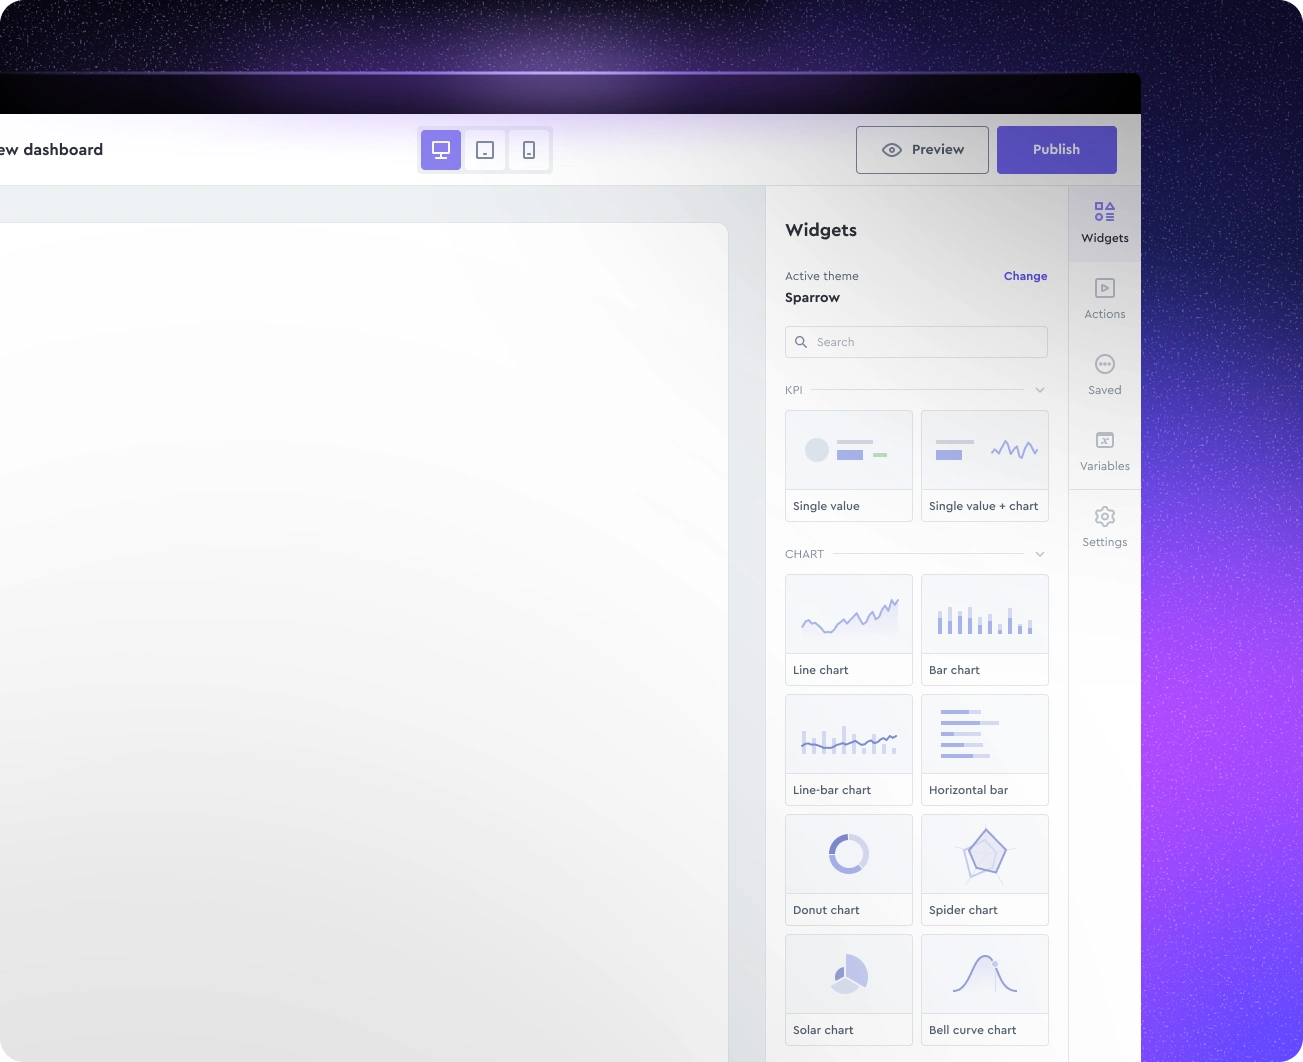
Dashboard builder - All widgets tab active
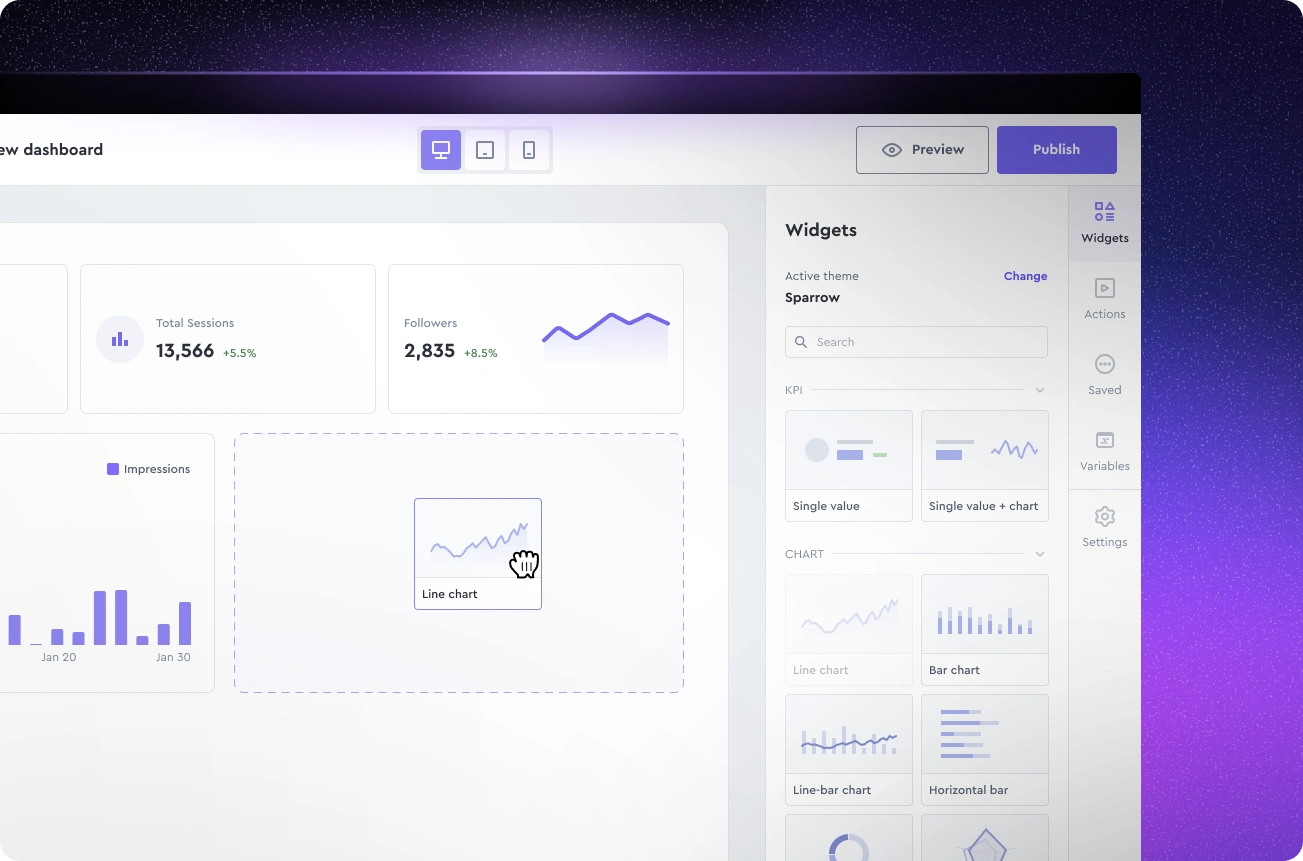
Dashboard builder -- Dragging and dropping a line chart widget to the canvas
Design system
Every element got componentized on a scalable basis, and the Atomic design approach in Figma.
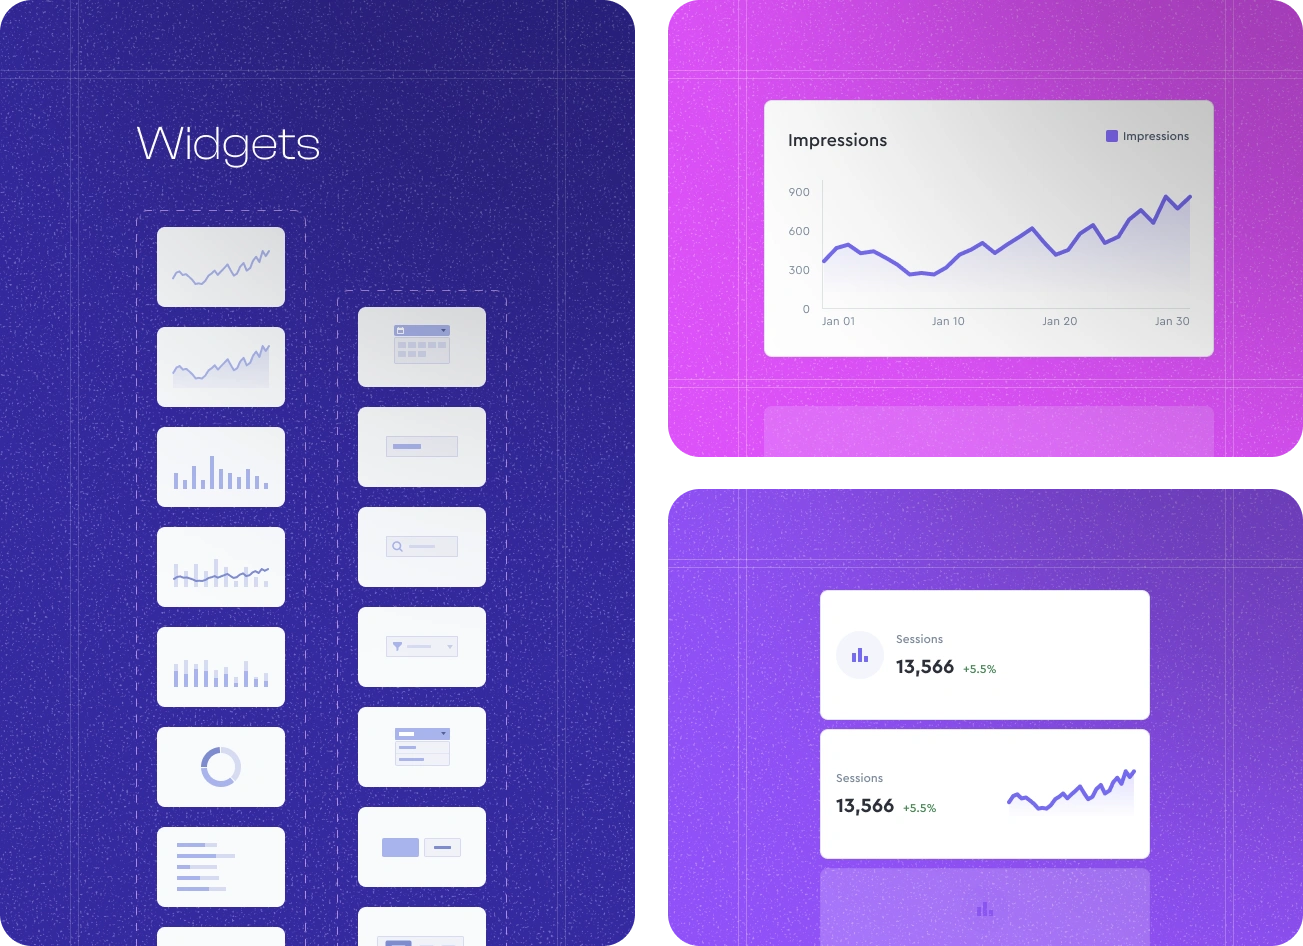
Dashboard widgets -- All componentized in Figma
Prototype
Clickable prototype tested with internal team and several prospective users; fixed pain points and edge cases (such as resizing widget guidelines, moving and overlapping widgets, and action widgets bugs).
Dragging and dropping a line chart widget and setting up in Dashboard builder
Outcome
First time to dashboard ~15 minutes
8 out of 10 test users built a complete dashboard in under 15 minutes on their very first try
Average “setup satisfaction” rating in exit survey: 4.6/5
Like this project
What the client had to say
Mohammad was able to jump right in and help knock out some important design work for a client. He juggled work requests across 3 clients and all were very happy with his work. highly recommended
Braden Ericson, BE SOFTWARE SOLUTIONS LLC
Jun 13, 2024, Client
Posted Jun 2, 2024
Designed a B2B SaaS dashboard builder feature with unified data visualization + kpi + content widgets to help busy small business owners.
Likes
1
Views
63
Timeline
Apr 17, 2024 - Jun 13, 2024
Clients
BE SOFTWARE SOLUTIONS LLC