Starbucks: Customer Segmentation
Leonardo Gonzalez
Executive Summary
The report presents findings from a comprehensive Starbucks Satisfaction Survey aimed at understanding customer preferences and behaviors. The study collected data through both online platforms and in-store participation, gathering information about demographics, purchase behaviors, and satisfaction levels.
Through factor analysis, I revealed three important factors affecting customer satisfaction:
High-quality goods and services
Amenities
Consistency/Timeliness
Using cluster analysis, the research identified three distinct customer segments:
The Starbucks Loyalists (53%)
Ambiance Enjoyers (18%)
Occasional Sippers (29%)
The report recommends several strategic initiatives to target each customer segment:
Enhance Loyalty Program
Leverage Store Amenities
Incentivize More Visits:
Survey
I received access to a Starbucks Satisfaction Survey to get a better idea of what customers like and don’t like about their experiences. The survey was shared online and in stores, so we got input from a wide range of people. The researchers began the surveys by asking basic questions like age, gender, and income, then moved on to topics like product quality, customer service, store vibe, and overall satisfaction.
Some sample questions were:
How long do you usually stay during a visit?
How do you typically enjoy Starbucks?
How much do you usually spend per visit?
Once they collected the responses, I analyzed the data to spot trends and group customers based on their satisfaction levels. This helped Starbucks understand what people want and how to improve their experience.
Below is an abbreviated version of the complete report.
Survey Findings:
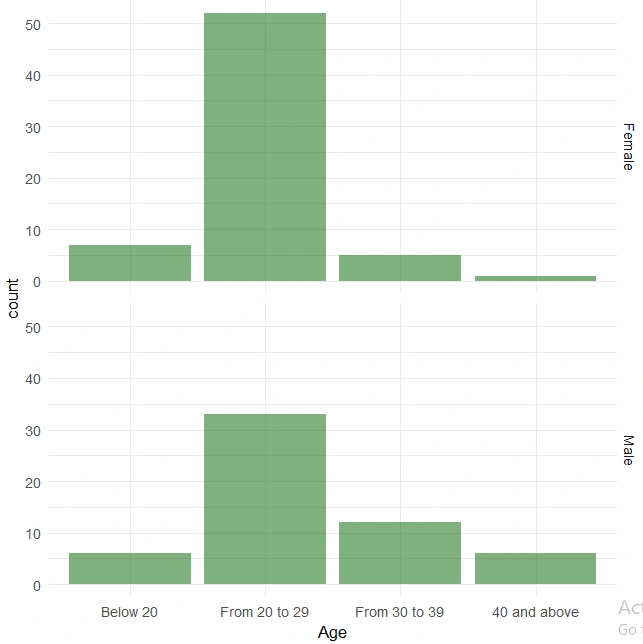
Gender and Age Breakdown
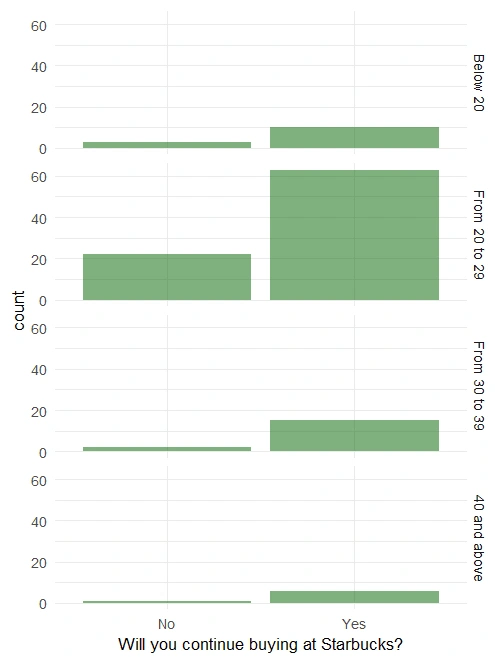
"Will You Continue Buying at Starbucks?" and Age Breakdown
Using factor analysis techniques, I was able to identify three major factors at play for customers.
High-quality goods and services
2. Amenities
3. Consistency/Timeliness
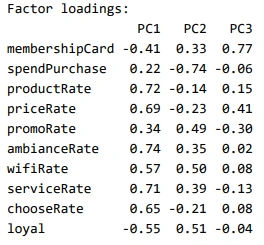
Showcases the importance of each survey question on the 3 chosen factors.
Cluster Analysis
Using our three important factors, we want to identify groups of “similar” customers. With a dendrogram, I found three clusters that capture a strong majority of the data.
Through segmentation, I was able to identify three distinct groups:
Cluster 1: The Starbucks Loyalists (53%)
Cluster 2: Ambiance Enjoyers (18%)
Cluster 3: Occasional Sippers (29%)
With these groups in mind, we can further dissect how each group differs from one another.
Using linear regression models, I was able to get a deeper understanding of how each segment varied.
A few takeaways:
As shown below, Starbucks loyalists are the ones who spend the most per purchase. Cluster 2, the Ambiance Enjoyers, significantly spend less by a factor of -0.833.
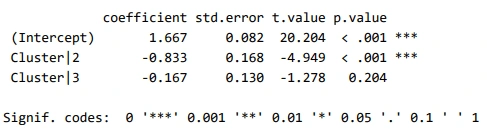
Linear Regression (OLS) of spending per purchase
Unsurprisingly, the ambiance enjoyers significantly rate the product less than the Starbucks loyalist by a factor of -0.909. Starbucks loyalists rate their products nearly a 4 out of 5 stars, while the ambiance enjoyers, on average, a 3 out of 5 stars.
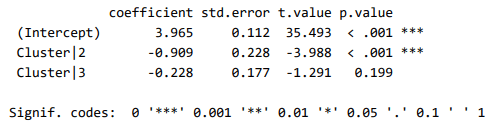
Linear Regression OLS of product rating
Cluster Findings
1. Starbucks Loyalists (53%)
The largest group of Starbucks consumers consists of loyal enthusiasts who not only love the products but also have the highest overall favorability toward the coffee shop. This group frequents Starbucks the most, spending extended time in-store and offering the highest ratings for both product and service quality. Their strong attachment to the brand is driven by consistent satisfaction with the coffee, food, and customer experience, making them repeat visitors who fully enjoy what Starbucks has to offer.
Unsurprisingly, this group is Starbucks’ targeted demographic: the “young, urban, affluent, white-collar professional who orders a specialty coffee drink.” This group is wealthier than the other two and has a higher level of employment.
2. Ambiance Enjoyers (18%)
The smallest of the three groups doesn’t visit Starbucks for the products or rate them highly. Instead, they are drawn to the store’s amenities, particularly the reliable Wi-Fi service and the overall friendliness of the staff. This group is slightly younger and views promotions as more important than the other groups. Additionally, these customers visit occasionally, not for the coffee or food, but to enjoy the relaxing atmosphere and social environment that the store provides. They see Starbucks as a comfortable space to spend time, valuing the ambiance over the actual offerings.
3. Occasional Sippers (29%)
The second largest group consists of customers who generally view Starbucks products favorably but don’t visit frequently or spend much. While they rate the quality of service and the products similarly to group one, their engagement with the brand is much lower. They enjoy Starbucks when they do visit but are less consistent in their patronage, likely seeking out the coffee shop only on special occasions or when it’s convenient.
Recommendations
Enhancing Loyalty Program
Starbucks loyalists by far have the highest level of membership. Since this group already has a high level of engagement and satisfaction, Starbucks should focus on deepening their loyalty. Expanding the Starbucks Rewards program to offer more personalized rewards based on purchase history, exclusive promotions, and early access to new products could further strengthen their loyalty.
Leverage Store Amenities
Although the smallest of the groups, they have the potential to be captured and encouraged to spend more. Additionally, any steps taken to elevate the store’s ambiance will also benefit the Starbucks loyalists as well. Starbucks should emphasize the non-product elements that these customers value. Offering seating areas designed for relaxation or remote work and promoting these features could attract more people looking for a pleasant environment. This may encourage more frequent visits from this group, potentially leading towards more sales.
Incentivizing More Visits
The Occasional Sipper has a high potential to become frequent as they already view and rate the products favorably. For this group, Starbucks could introduce targeted marketing campaigns focused on increasing visit frequency and spending. Offering time-limited promotions, discounts, or bundle deals could encourage them to visit more. Since they already like the products and service, small incentives could make a big difference in their frequency of visits.
Limitations
One potential limitation of this analysis is the sample size, as the survey only gathered 132 responses over a two-day period. Ideally, the survey would have been conducted across multiple Starbucks locations over a longer timeframe to capture a broader and more diverse range of responses, providing a clearer and more accurate picture.
This survey was provided by Starbucks, and while it offered valuable insights, some of the questions could have been reworded to improve clarity and elicit more detailed or accurate responses. Another limitation is the nature of the e-survey, which might reflect customers' opinions based on recent experiences rather than long-term patterns or typical behavior.
Conclusion
Our analysis of Starbucks customer segments revealed three distinct groups: Starbucks Loyalists (53%), Ambiance Enjoyers (18%), and Occasional Sippers (29%). Each segment presents unique opportunities for growth and engagement. The Loyalists form a strong foundation for the business, while Ambiance Enjoyers and Occasional Sippers represent significant potential for increased revenue through targeted approaches.
Based on these findings, we recommend enhancing the loyalty program to retain Loyalists, improving store amenities to attract Ambiance Enjoyers, and developing targeted promotions to increase visit frequency among Occasional Sippers. While the study's limited sample size suggests the need for broader research, these insights provide clear direction for improving customer engagement and satisfaction across all segments.
Like this project
Posted Jan 5, 2025
I collaborated with a Starbucks representative to analyze a previously conducted customer satisfaction survey.
Likes
1
Views
202