Cafe Restaurant Customer Survey
Leonardo Gonzalez
Cafe Restaurant Customer Survey
Executive Summary
The owner of a cafe restaurant conducted a survey to gain insights into their customers’ experiences over a period of time. I was instructed to use the data to find areas of improvement and valuable feedback. I began by cleaning the data and addressing underlying issues to enable more effective analysis and uncover meaningful insights.
During exploratory analysis, I found that customers rated ‘Overall Delivery Experience,’ ‘Food Quality,’ and ‘Speed of Delivery’ very highly, reflecting strong performance by the cafe. However, upon closer inspection, the ‘Order Accuracy’ ratings were significantly above the industry standard, indicating a potential problem.
Although the survey revealed positive sentiment among customers, its design leaves much to be desired. It lacks quality checks to ensure customers provide genuine feedback on their experiences.
My recommendation to the owner is to prioritize implementing quality control measures, as the high inaccuracy rate in orders is a critical issue. Additionally, a more detailed and tailored survey should be developed to better capture customer insights. The initial survey, while a great starting point, provides an opportunity to design a more robust survey that can collect more accurate and actionable data.
Introduction
A cafe restaurant designed and conducted a survey to better understand customer perceptions. The survey, created by the restaurant owners, received responses from over 8,000 participants over an undisclosed period. The survey’s stated purpose was to ‘gain feedback, insights, and opinions from customers.’
The purpose of my analysis is to help the owners uncover valuable insights and identify opportunities to enhance the customer experience. My goal is to support the cafe in improving both the customer experience and its business practices.
With the survey data in my possession, I began by cleaning the data, addressing several errors and missing variables. I also renamed and recoded some variables to make them more intuitive. Afterward, I explored the data in detail.
Exploration
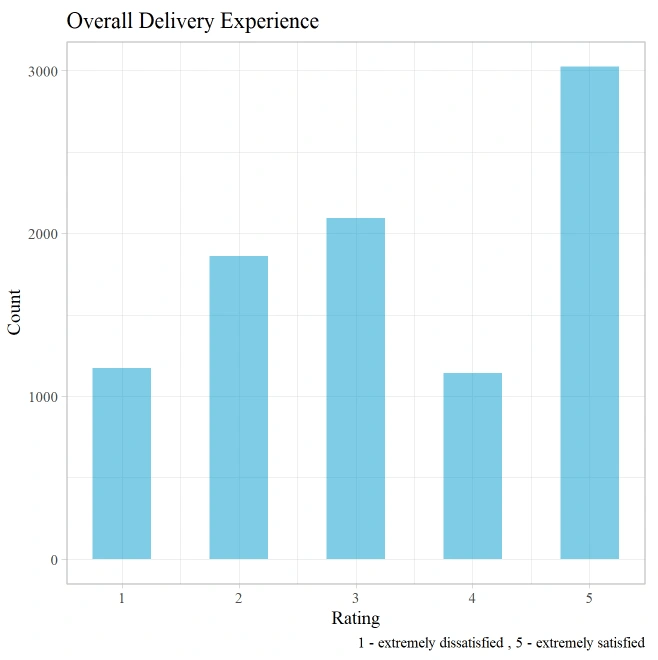
Overall Delivery Experience
I started the exploratory process by creating some tables and graphs to break down the responses to each question. Early on, a clear pattern emerged: most questions received very high ratings, and their distributions were pretty similar across the board.
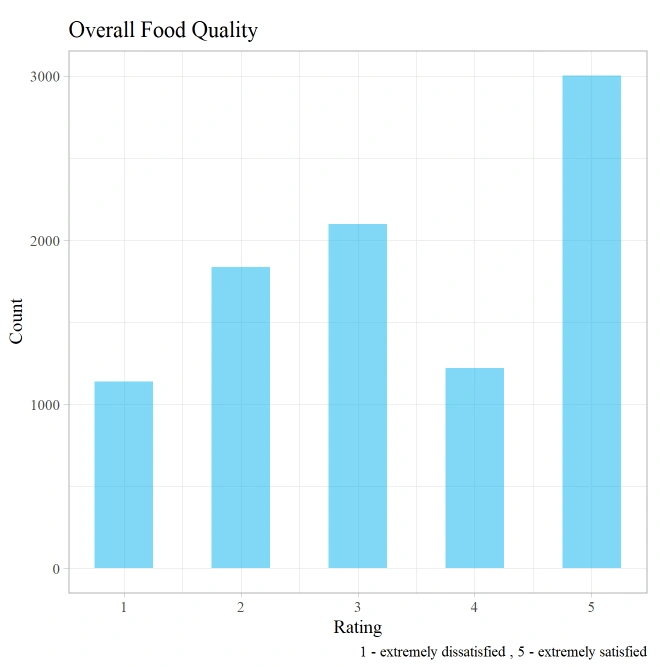
Food Quality
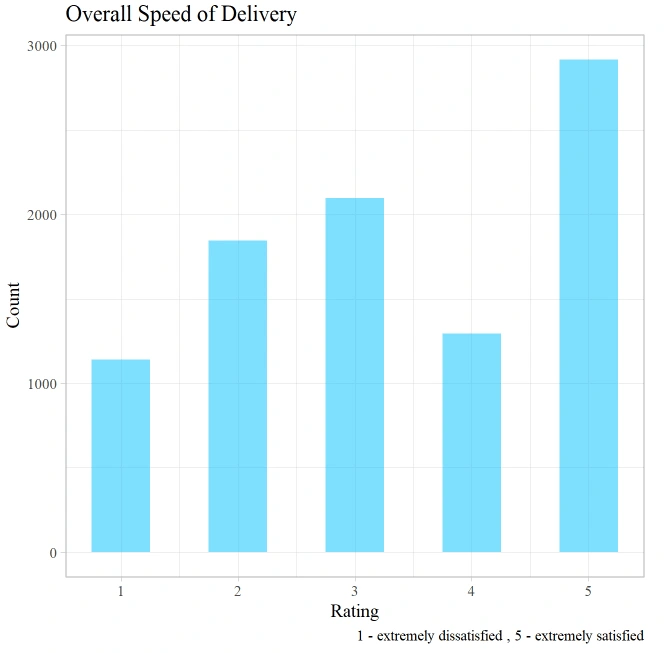
Speed Delivery
Order Accuracy
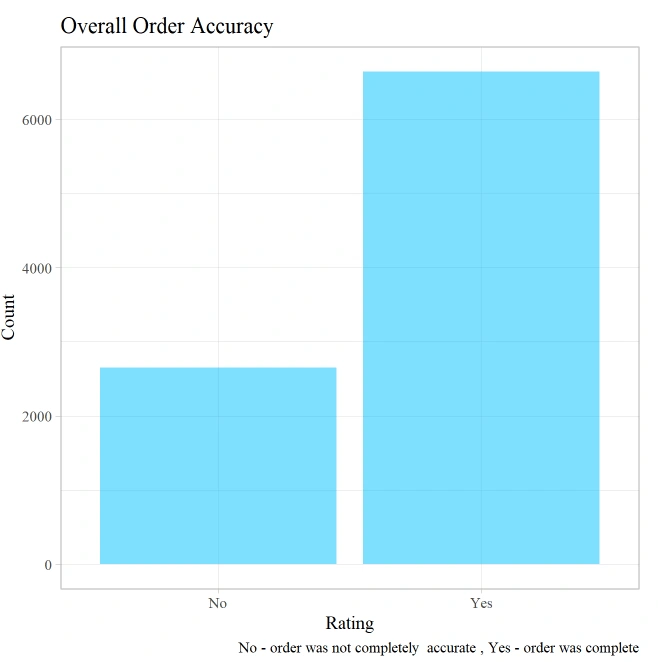
What we know
There is little variation in ratings for ‘Overall Delivery Experience,’ ‘Food Quality,’ and ‘Speed of Delivery.’ However, one aspect stands out: ‘Order Accuracy’ is concerning.
Looking at percentages,
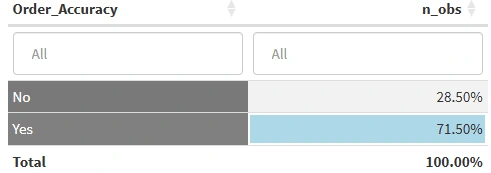
28.5% of respondents reported that their order was not accurate, which is a big problem.
Digging deeper, I filtered responses from those who answered ‘No’ to the accuracy question and examined their ratings for ‘Food Quality.’
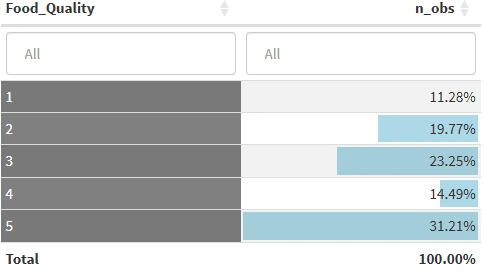
and compared it to the ratings of those who responded ‘Yes’ to the accuracy question for ‘Food Quality’
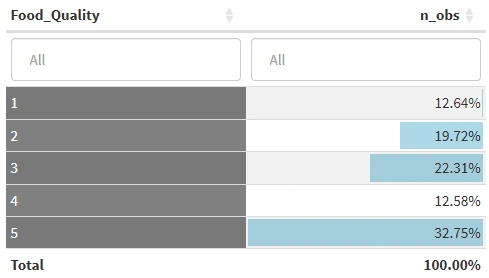
When separating the two groups, it becomes clear that there is little difference in how each group responded to the other questions.
Customers who reported an inaccuracy in their order were just as likely to give the cafe a rating of 5 for both delivery times and food quality as those who stated their order was accurate. Receiving an incorrect item did not cause customers to view the product less favorably or rate it lower.
I also ran a correlation matrix to identify any patterns within the survey. Interestingly, there were no strong relationships between how customers responded to the accuracy question and the other questions.
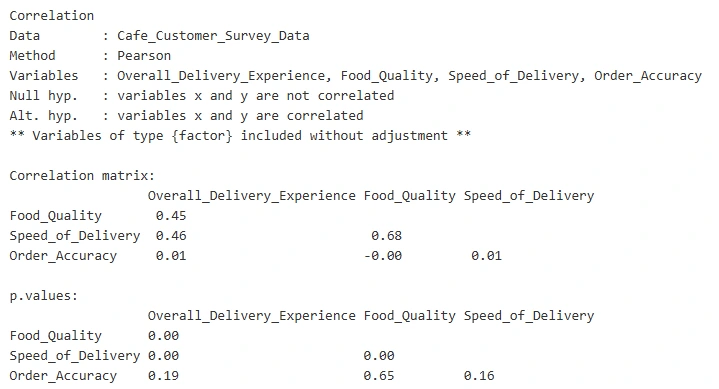
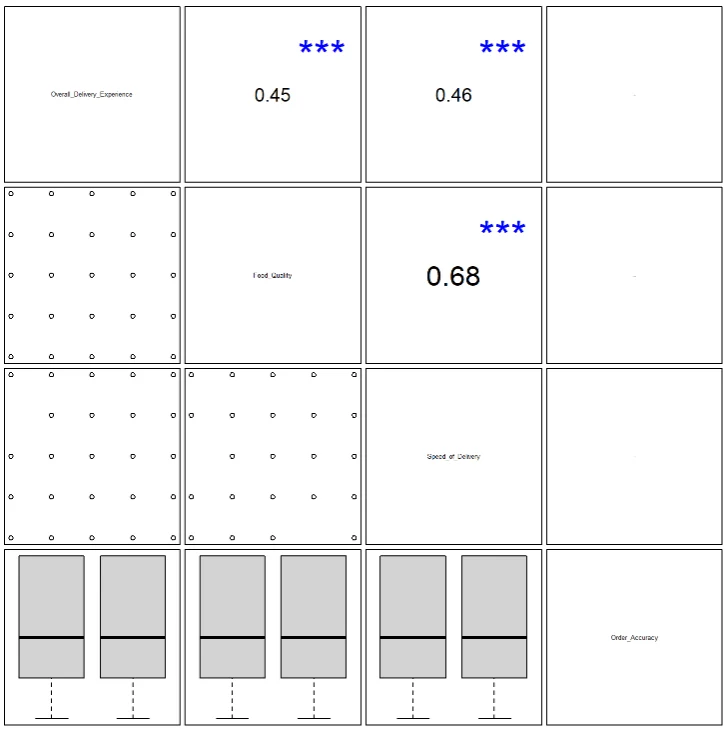
The table shows no meaningful correlations between how respondents answered the accuracy question and its impact on other questions.
However, it is worth noting a significant correlation between ‘Speed of Delivery’ and ‘Food Quality.’
Findings
After some exploratory analysis, one major issue stands out: the survey questions may have failed to capture the full picture.
The results for ‘Overall Delivery Experience,’ ‘Food Quality,’ and ‘Speed of Delivery’ provide valuable insights that any food establishment would appreciate, highlighting strong performance metrics.
However, the results for ‘Order Accuracy’ undermine these positive findings. The data shows that approximately 3 out of 10 customers reported an inaccuracy in their order. This is a significant concern, especially in the restaurant industry, where the average inaccuracy rate is typically no more than 5%.
Accuracy must be prioritized.
Looking deeper, I believe the real issue lies with the survey design itself.
Recommendations
Taking the survey at face value, I would recommend that the restaurant owners implement quality control measures to reduce inaccuracies. An almost 30% inaccuracy rate in orders severely impacts the café’s perception. Beyond the immediate costs of remaking orders due to inconsistencies, there are long-term consequences, including customer dissatisfaction, negative reviews, and potential reputation damage.
However, I believe the more significant improvement should be the design of a more comprehensive survey to better understand the underlying motives and opinions of customers.
The survey would benefit from additional questions to gauge customer opinions more thoroughly. Including more detailed questions about the experience itself could significantly enhance the analysis.
Another concern is the possibility of response bias. Respondents may have clicked 5 stars across the board without thoroughly considering their answers. This lack of variation among responses could explain the disproportionately high number of 5-star ratings across multiple questions.
One way to address this potential issue is by including a reverse-coded question, such as:
Rate the extent to which you agree with the following statement on a scale of 1 to 5
‘I was not content with the speed of delivery.’
1 = I completely disagree, 5 = I completely agree
If respondents were blindly clicking 5 throughout the survey, a reverse-coded question like this would help identify them. A thoughtful respondent who had a great experience would ideally rate a 5 for the speed of delivery and a 1 for the reverse-coded statement, as it contradicts their positive experience.
I recommend conducting a secondary, more in-depth survey to fully understand the customers’ experiences. A well-designed survey would help clarify the findings of the initial survey and provide a clearer picture.
In particular, I suggest further exploration into order accuracy. If the initial survey results, showing that 28.5% of customers encountered an inaccuracy in their order, are truly reflective of the experience, a follow-up survey could help identify and address these issues.
Overall, the survey is an excellent first step toward improving the customer experience. It also provides an opportunity to refine future surveys to collect better, more actionable data.
Like this project
Posted Jan 10, 2025
Customer insights on a survey designed by the owners. I found the cafe had high ratings for delivery, but order accuracy and survey design were concerning.
Likes
1
Views
20