Jito Explorer · Real-Time MEV Dashboard for Solana
Orezi Mena
Client:Jito LabsProductJito Explorer – the first MEV dashboard for Solana
Objective: Make the invisible visible: give builders, traders, and researchers a real-time window into Solana MEV flows—bundles, tips, validator take-rates—without drowning them in raw RPC logs.
Scope: Data-model mapping → UX architecture → dark-mode UI kit → responsive layouts (desktop / tablet / mobile) → hand-off to front-end & Rust/TypeScript data team
Timeline: 3 weeks

The Challenge
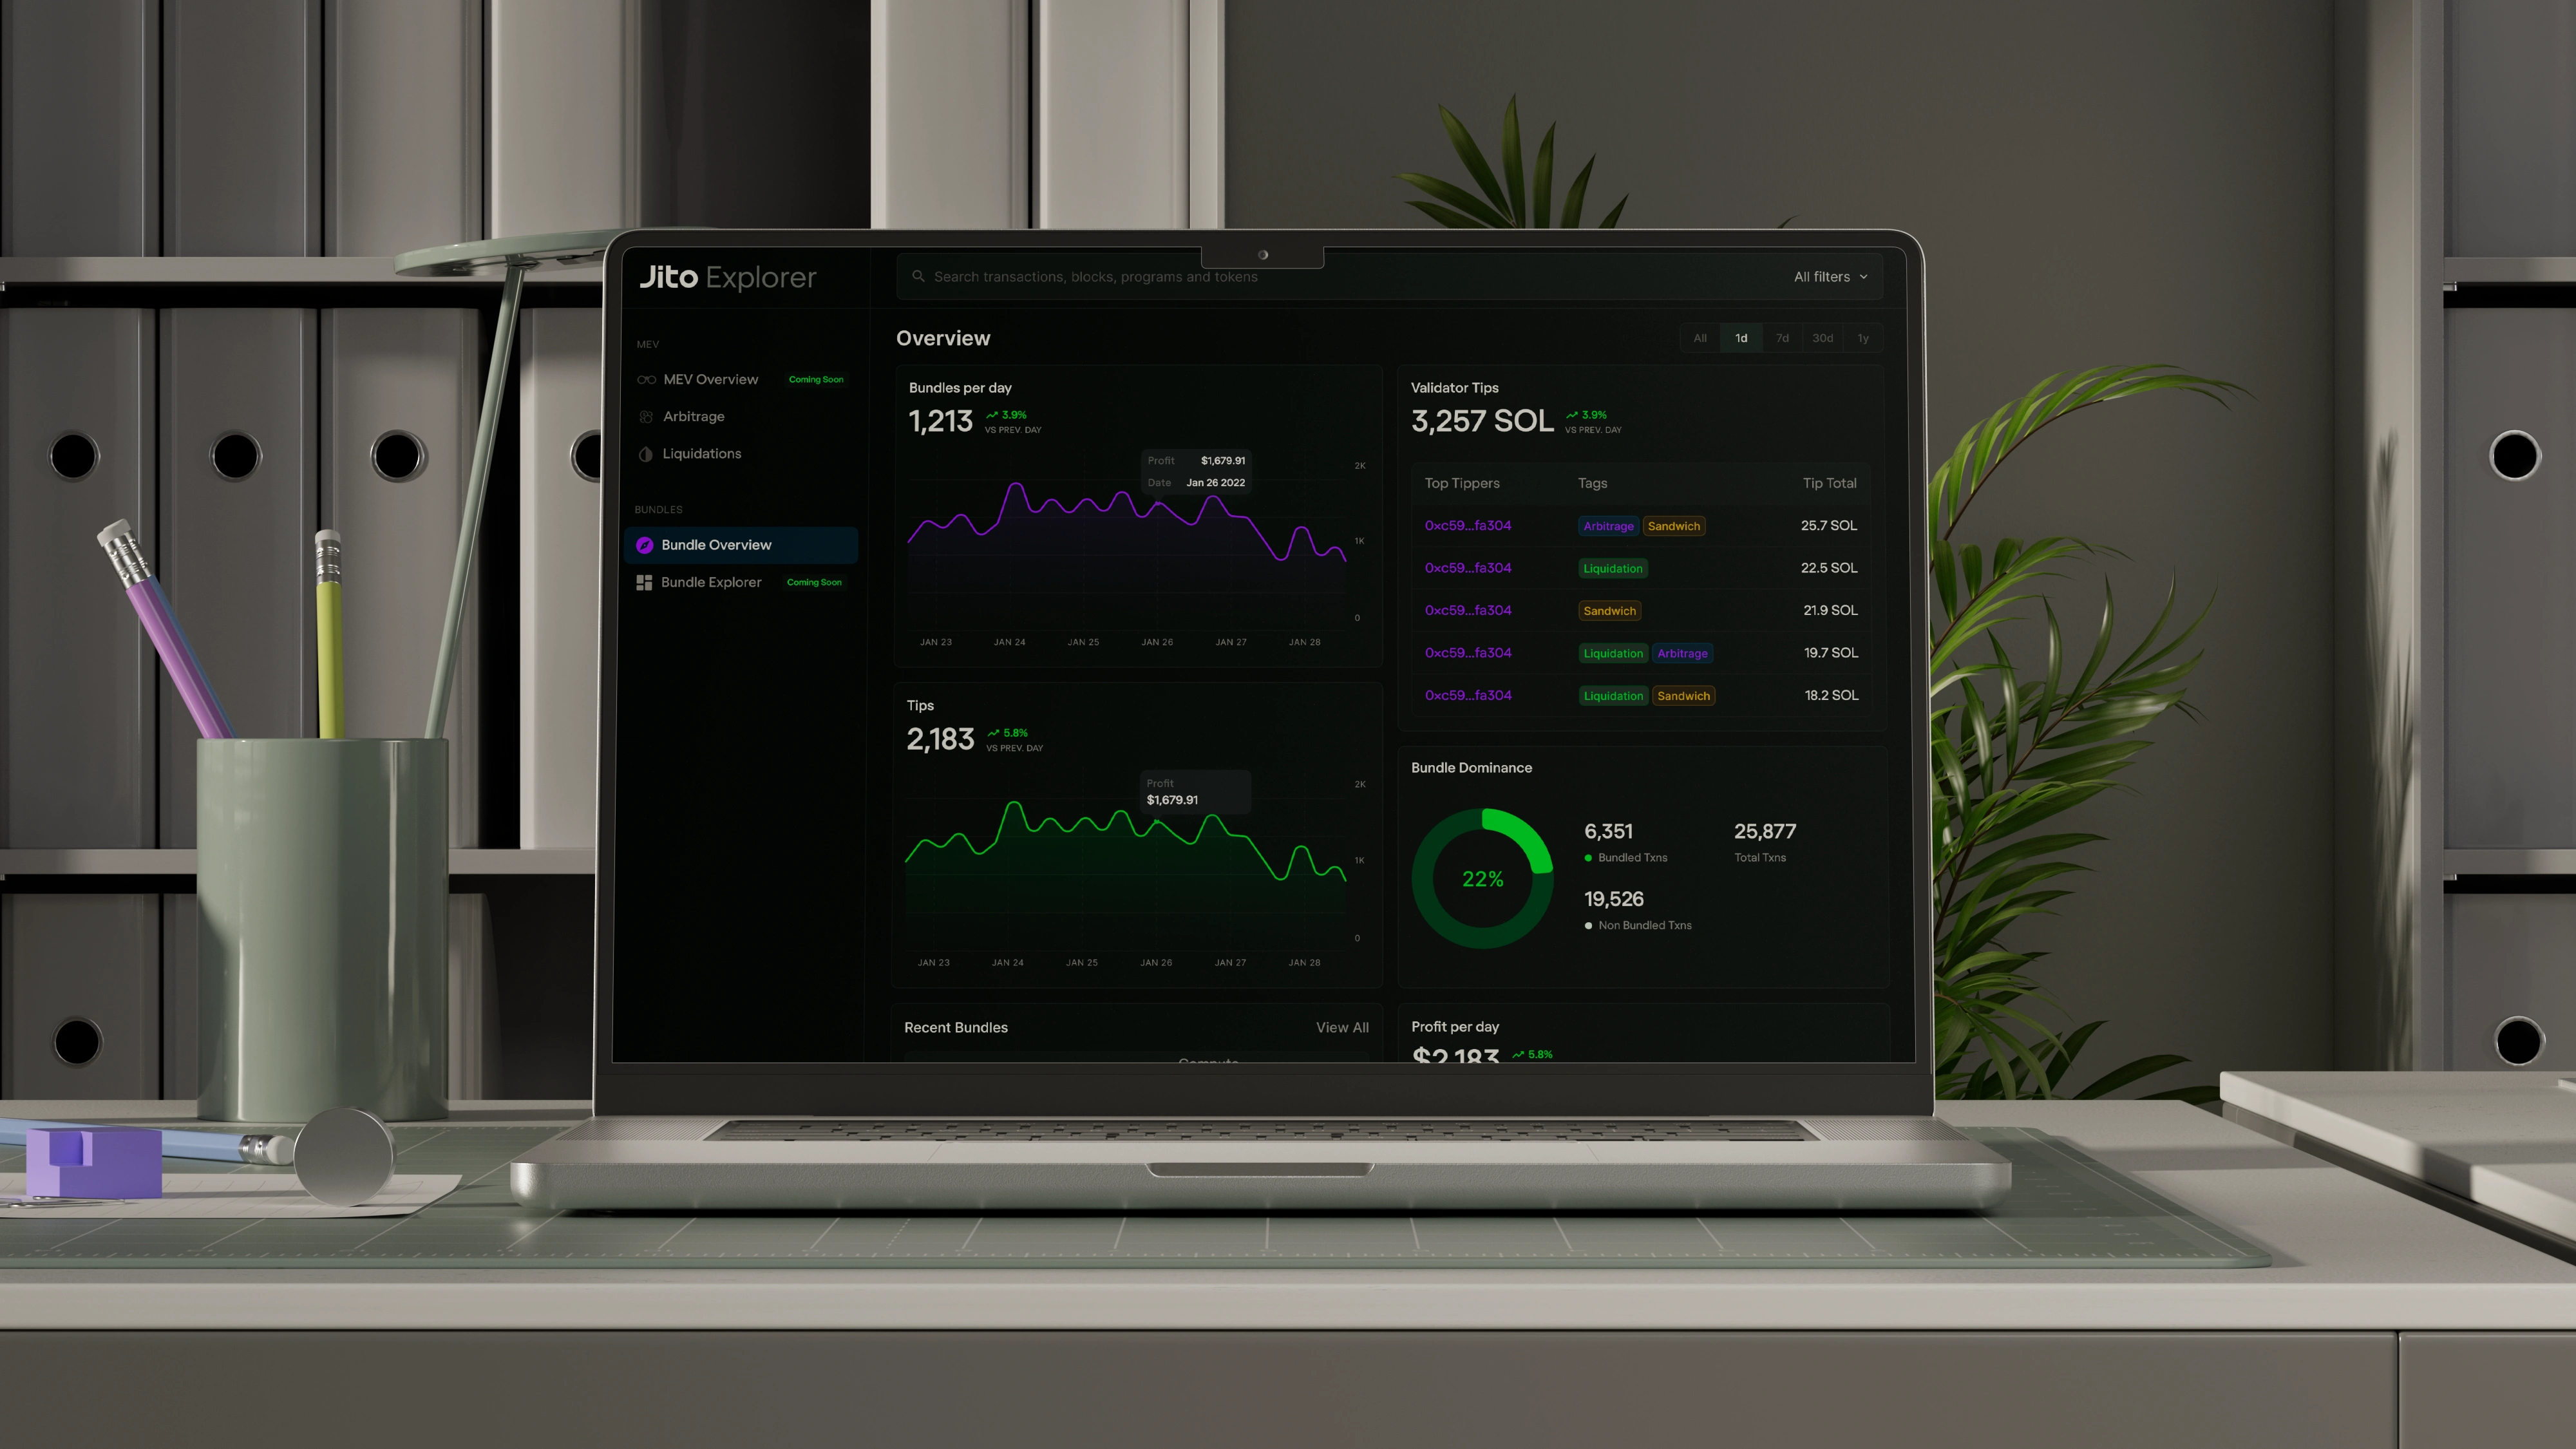
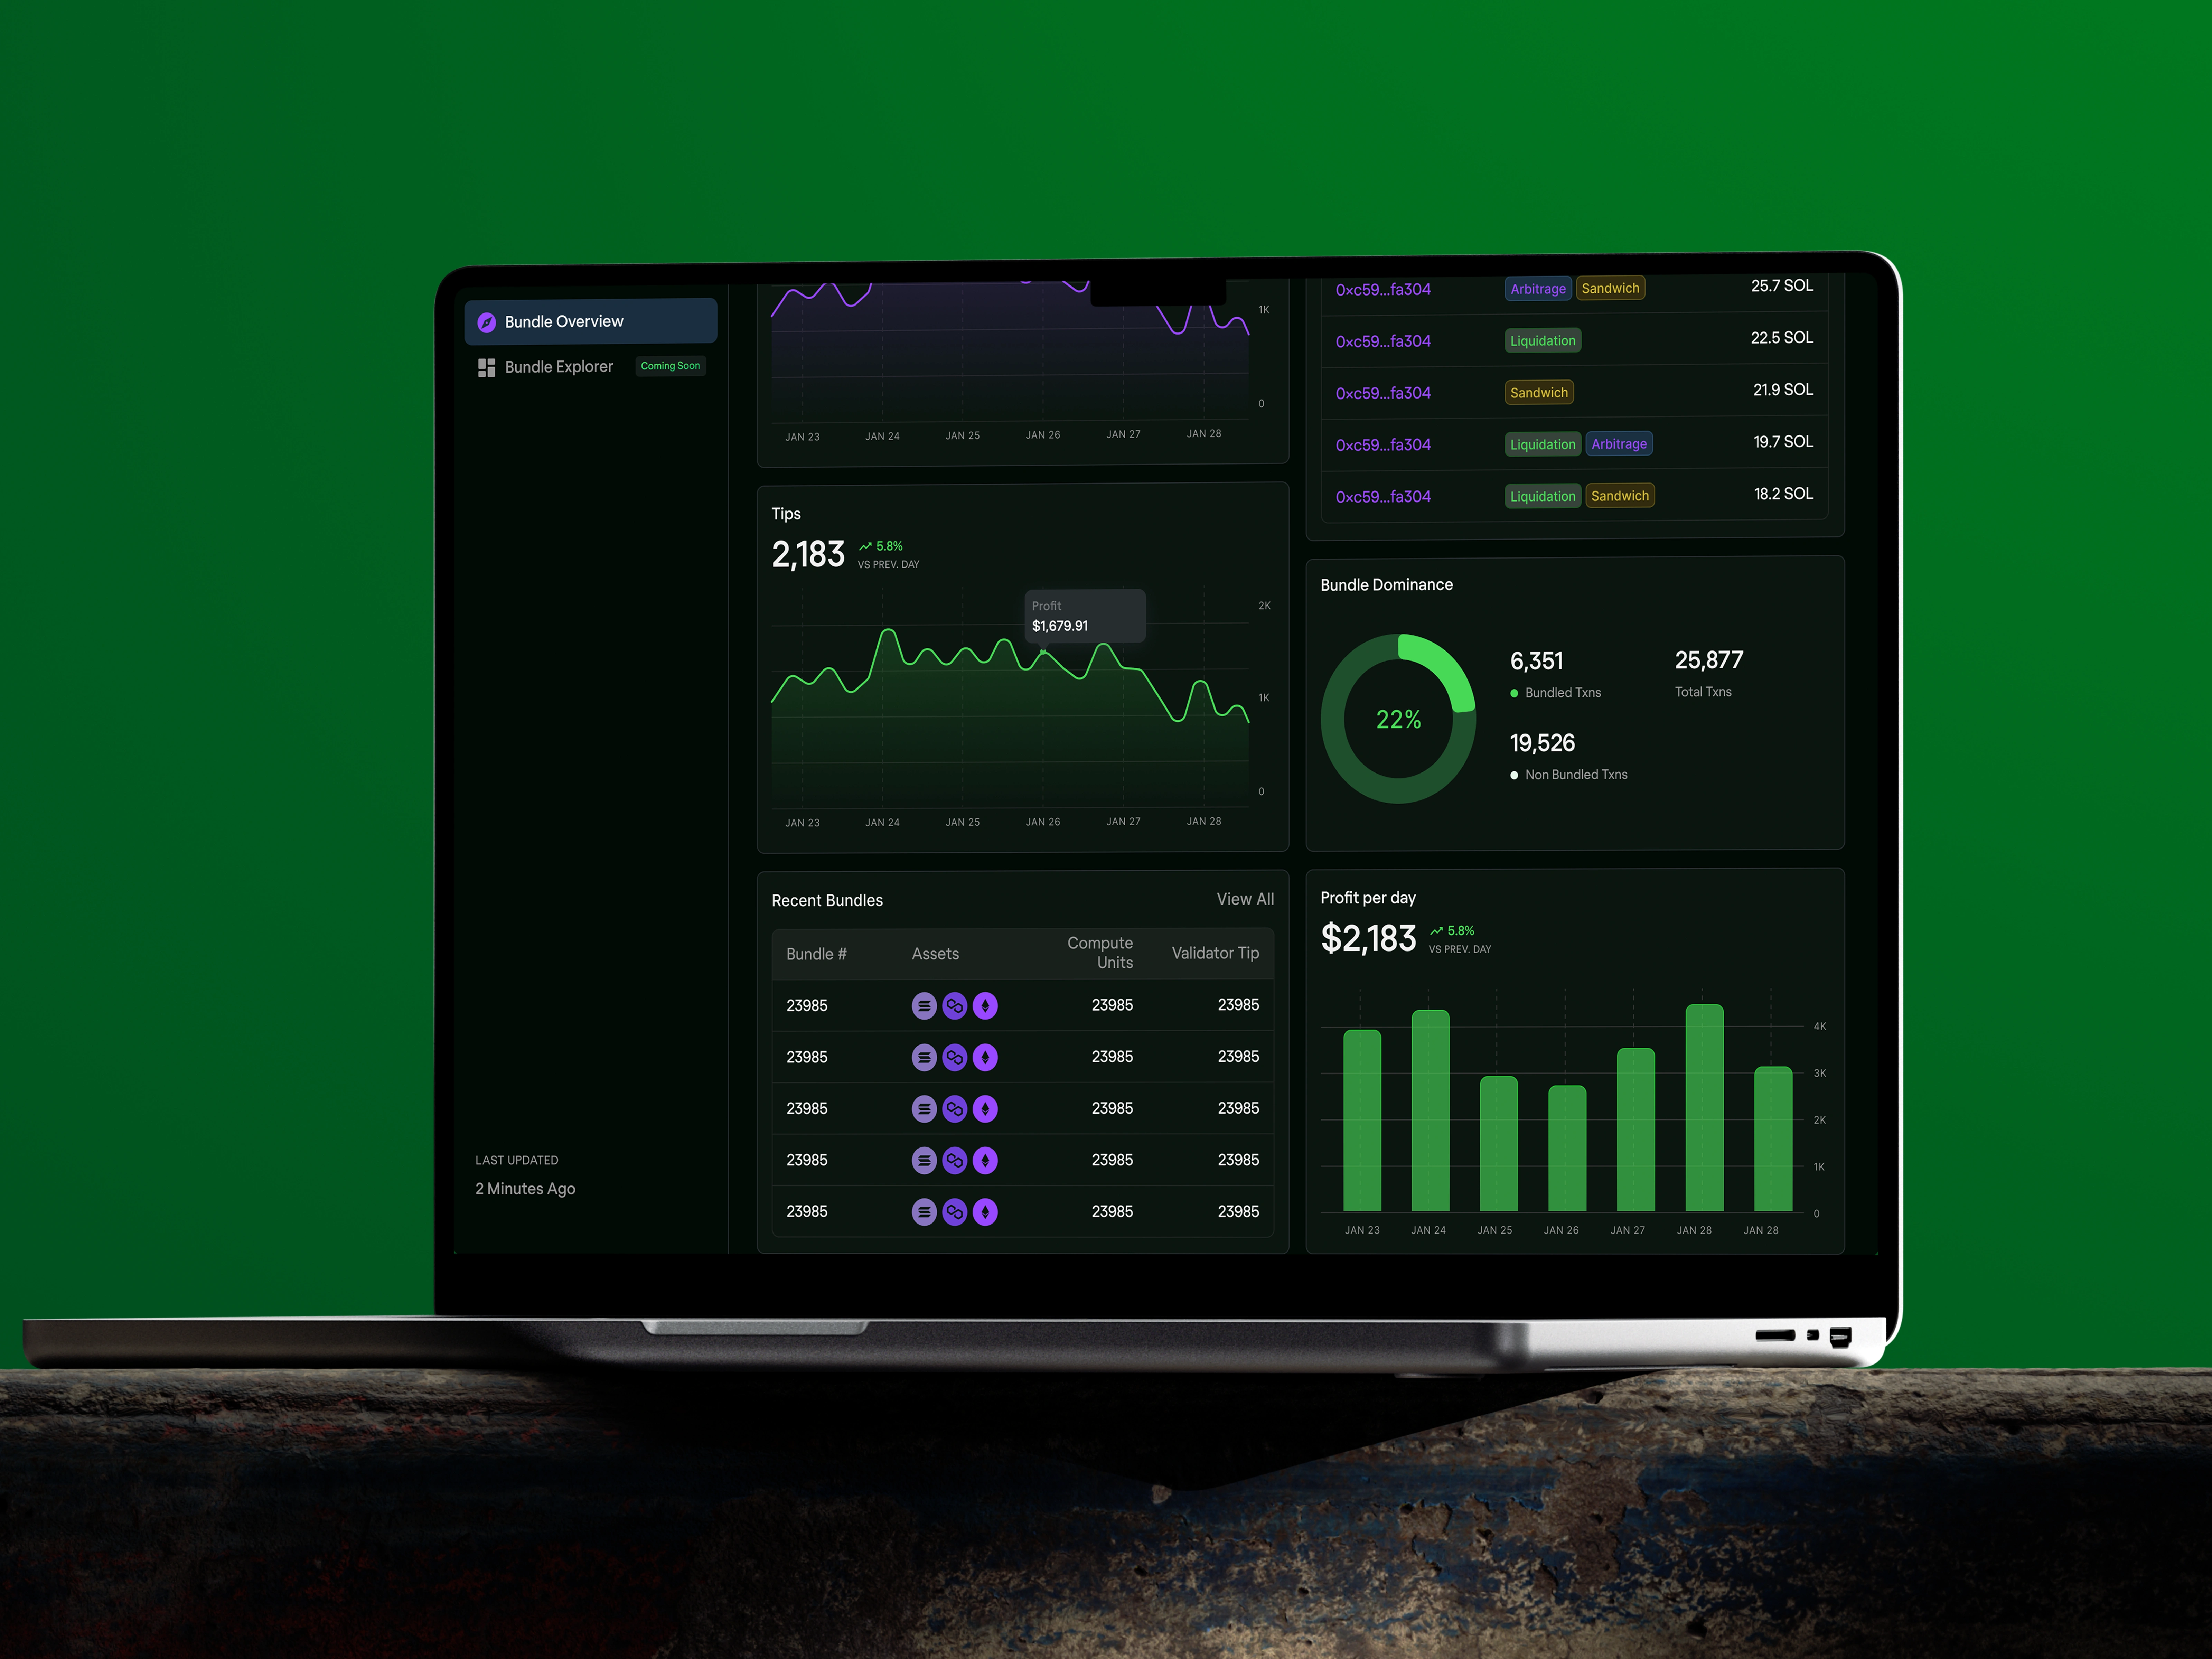
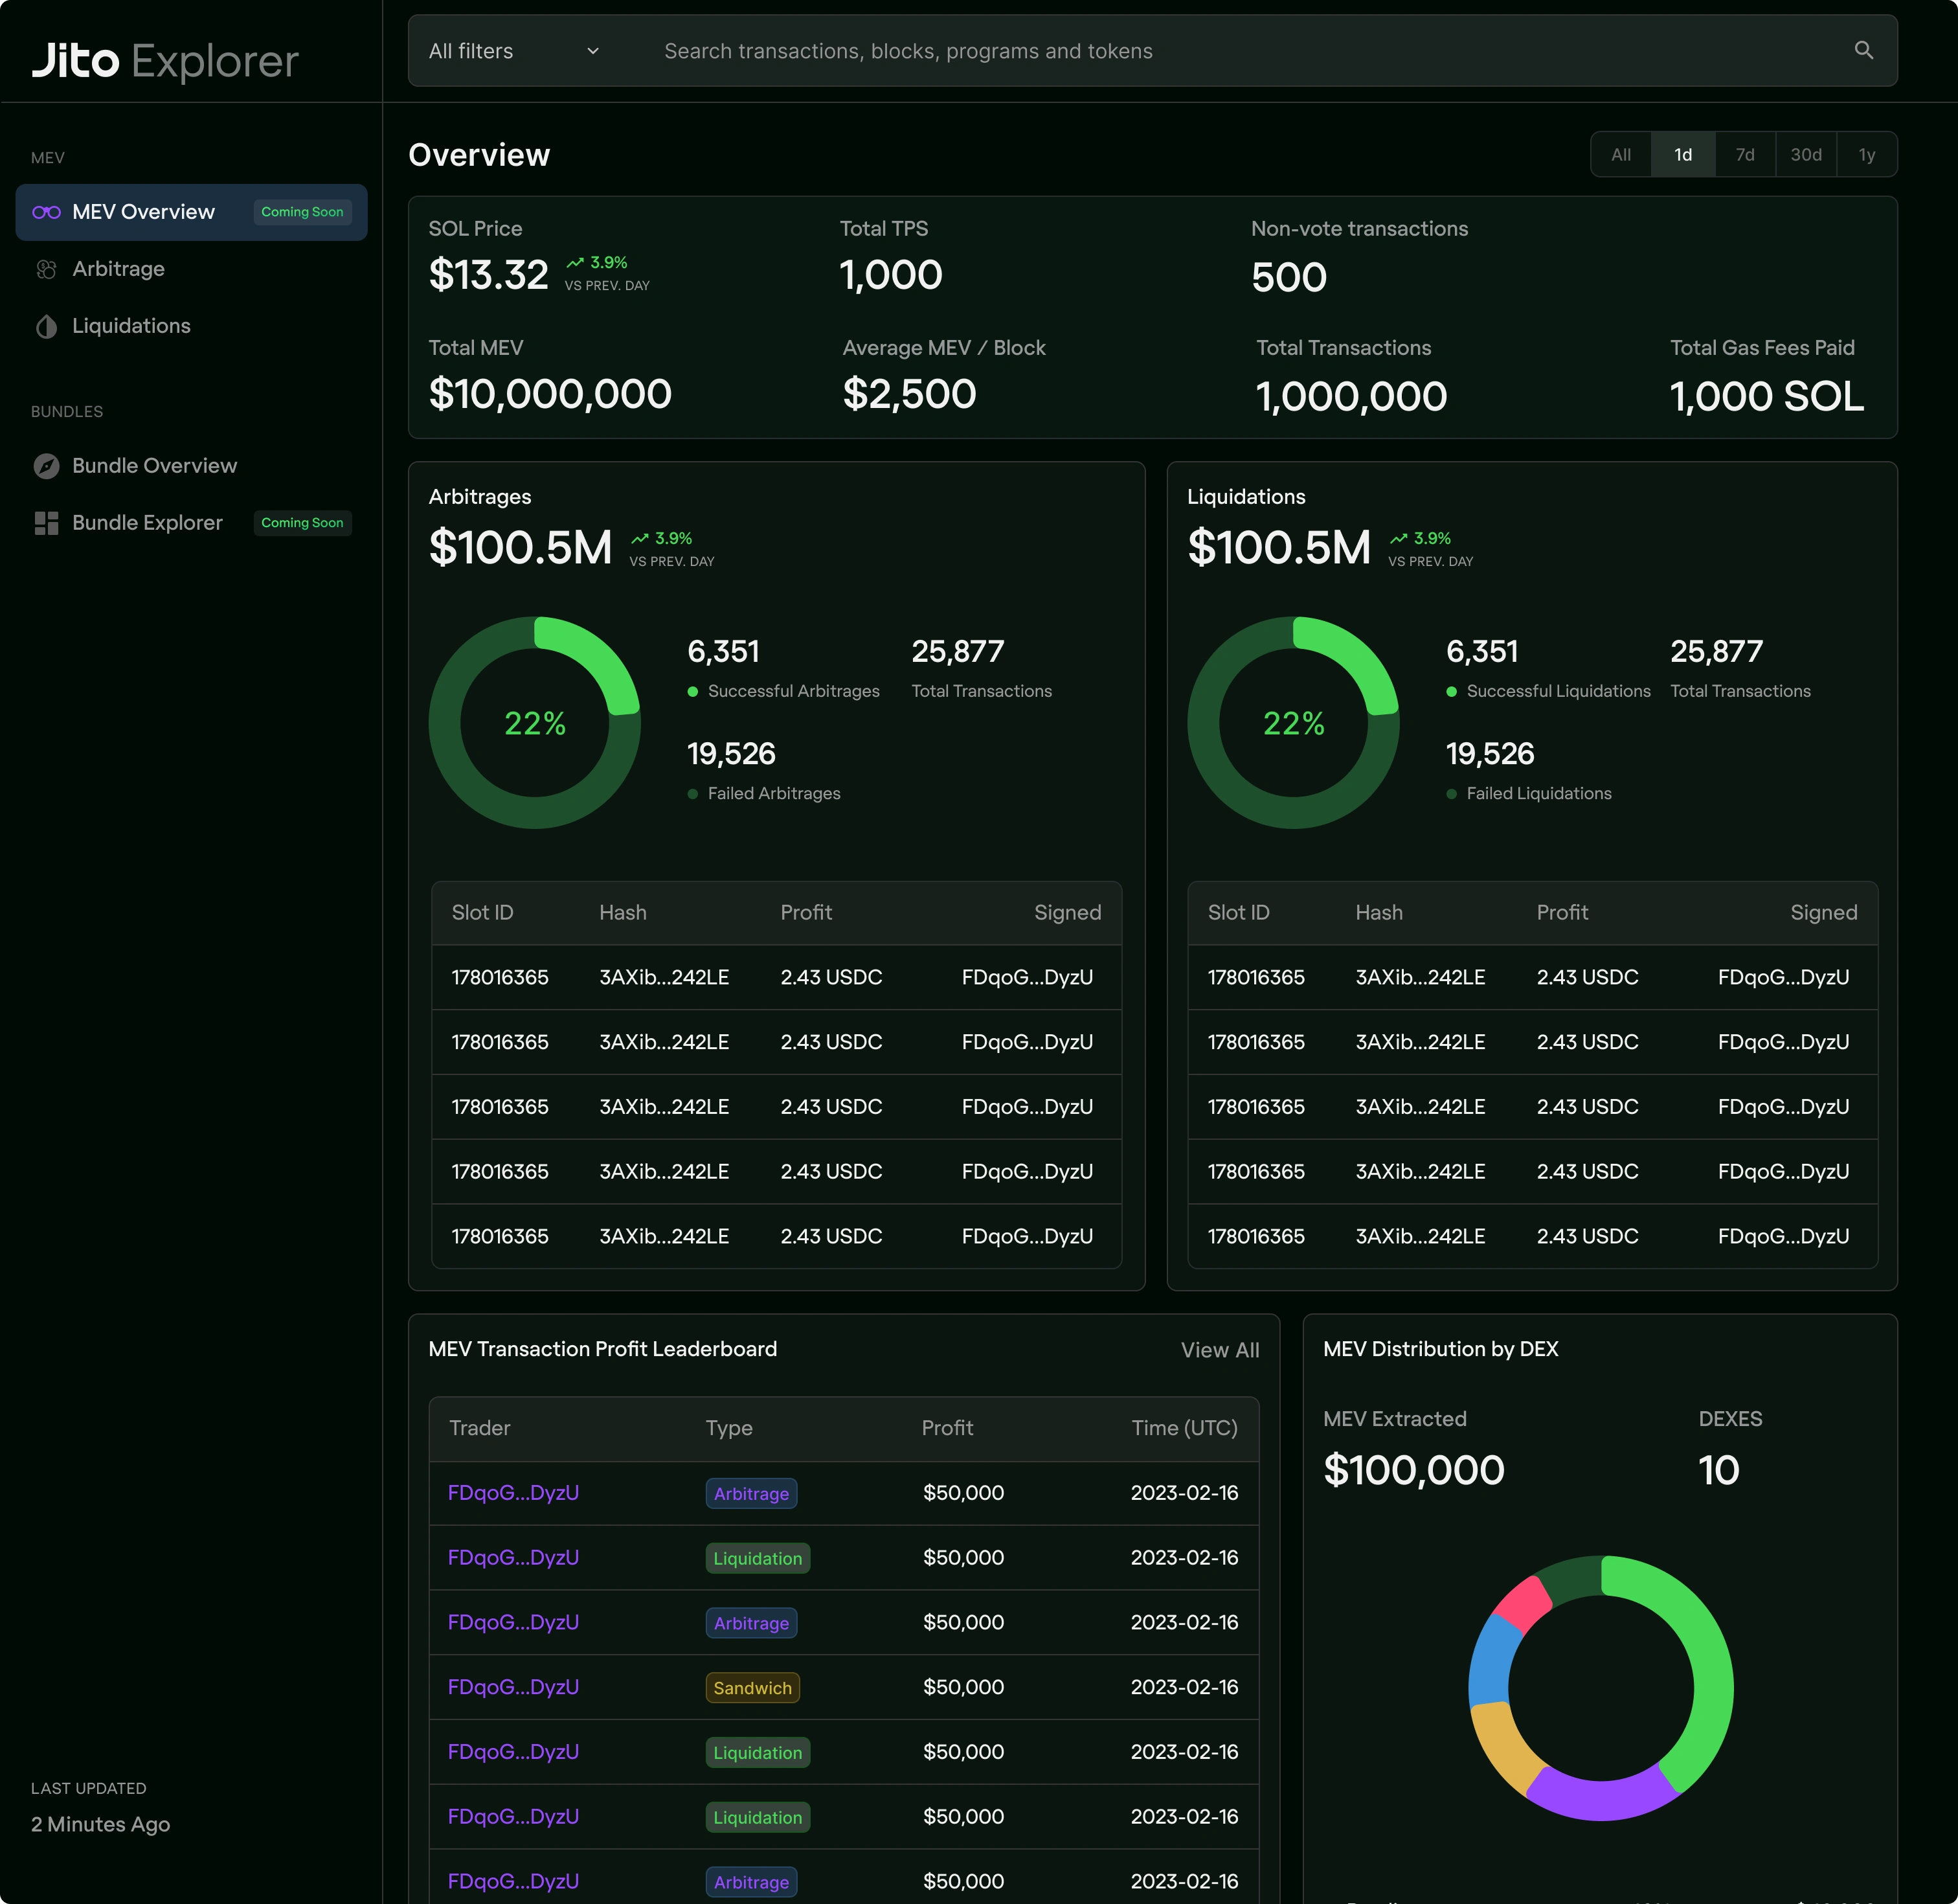
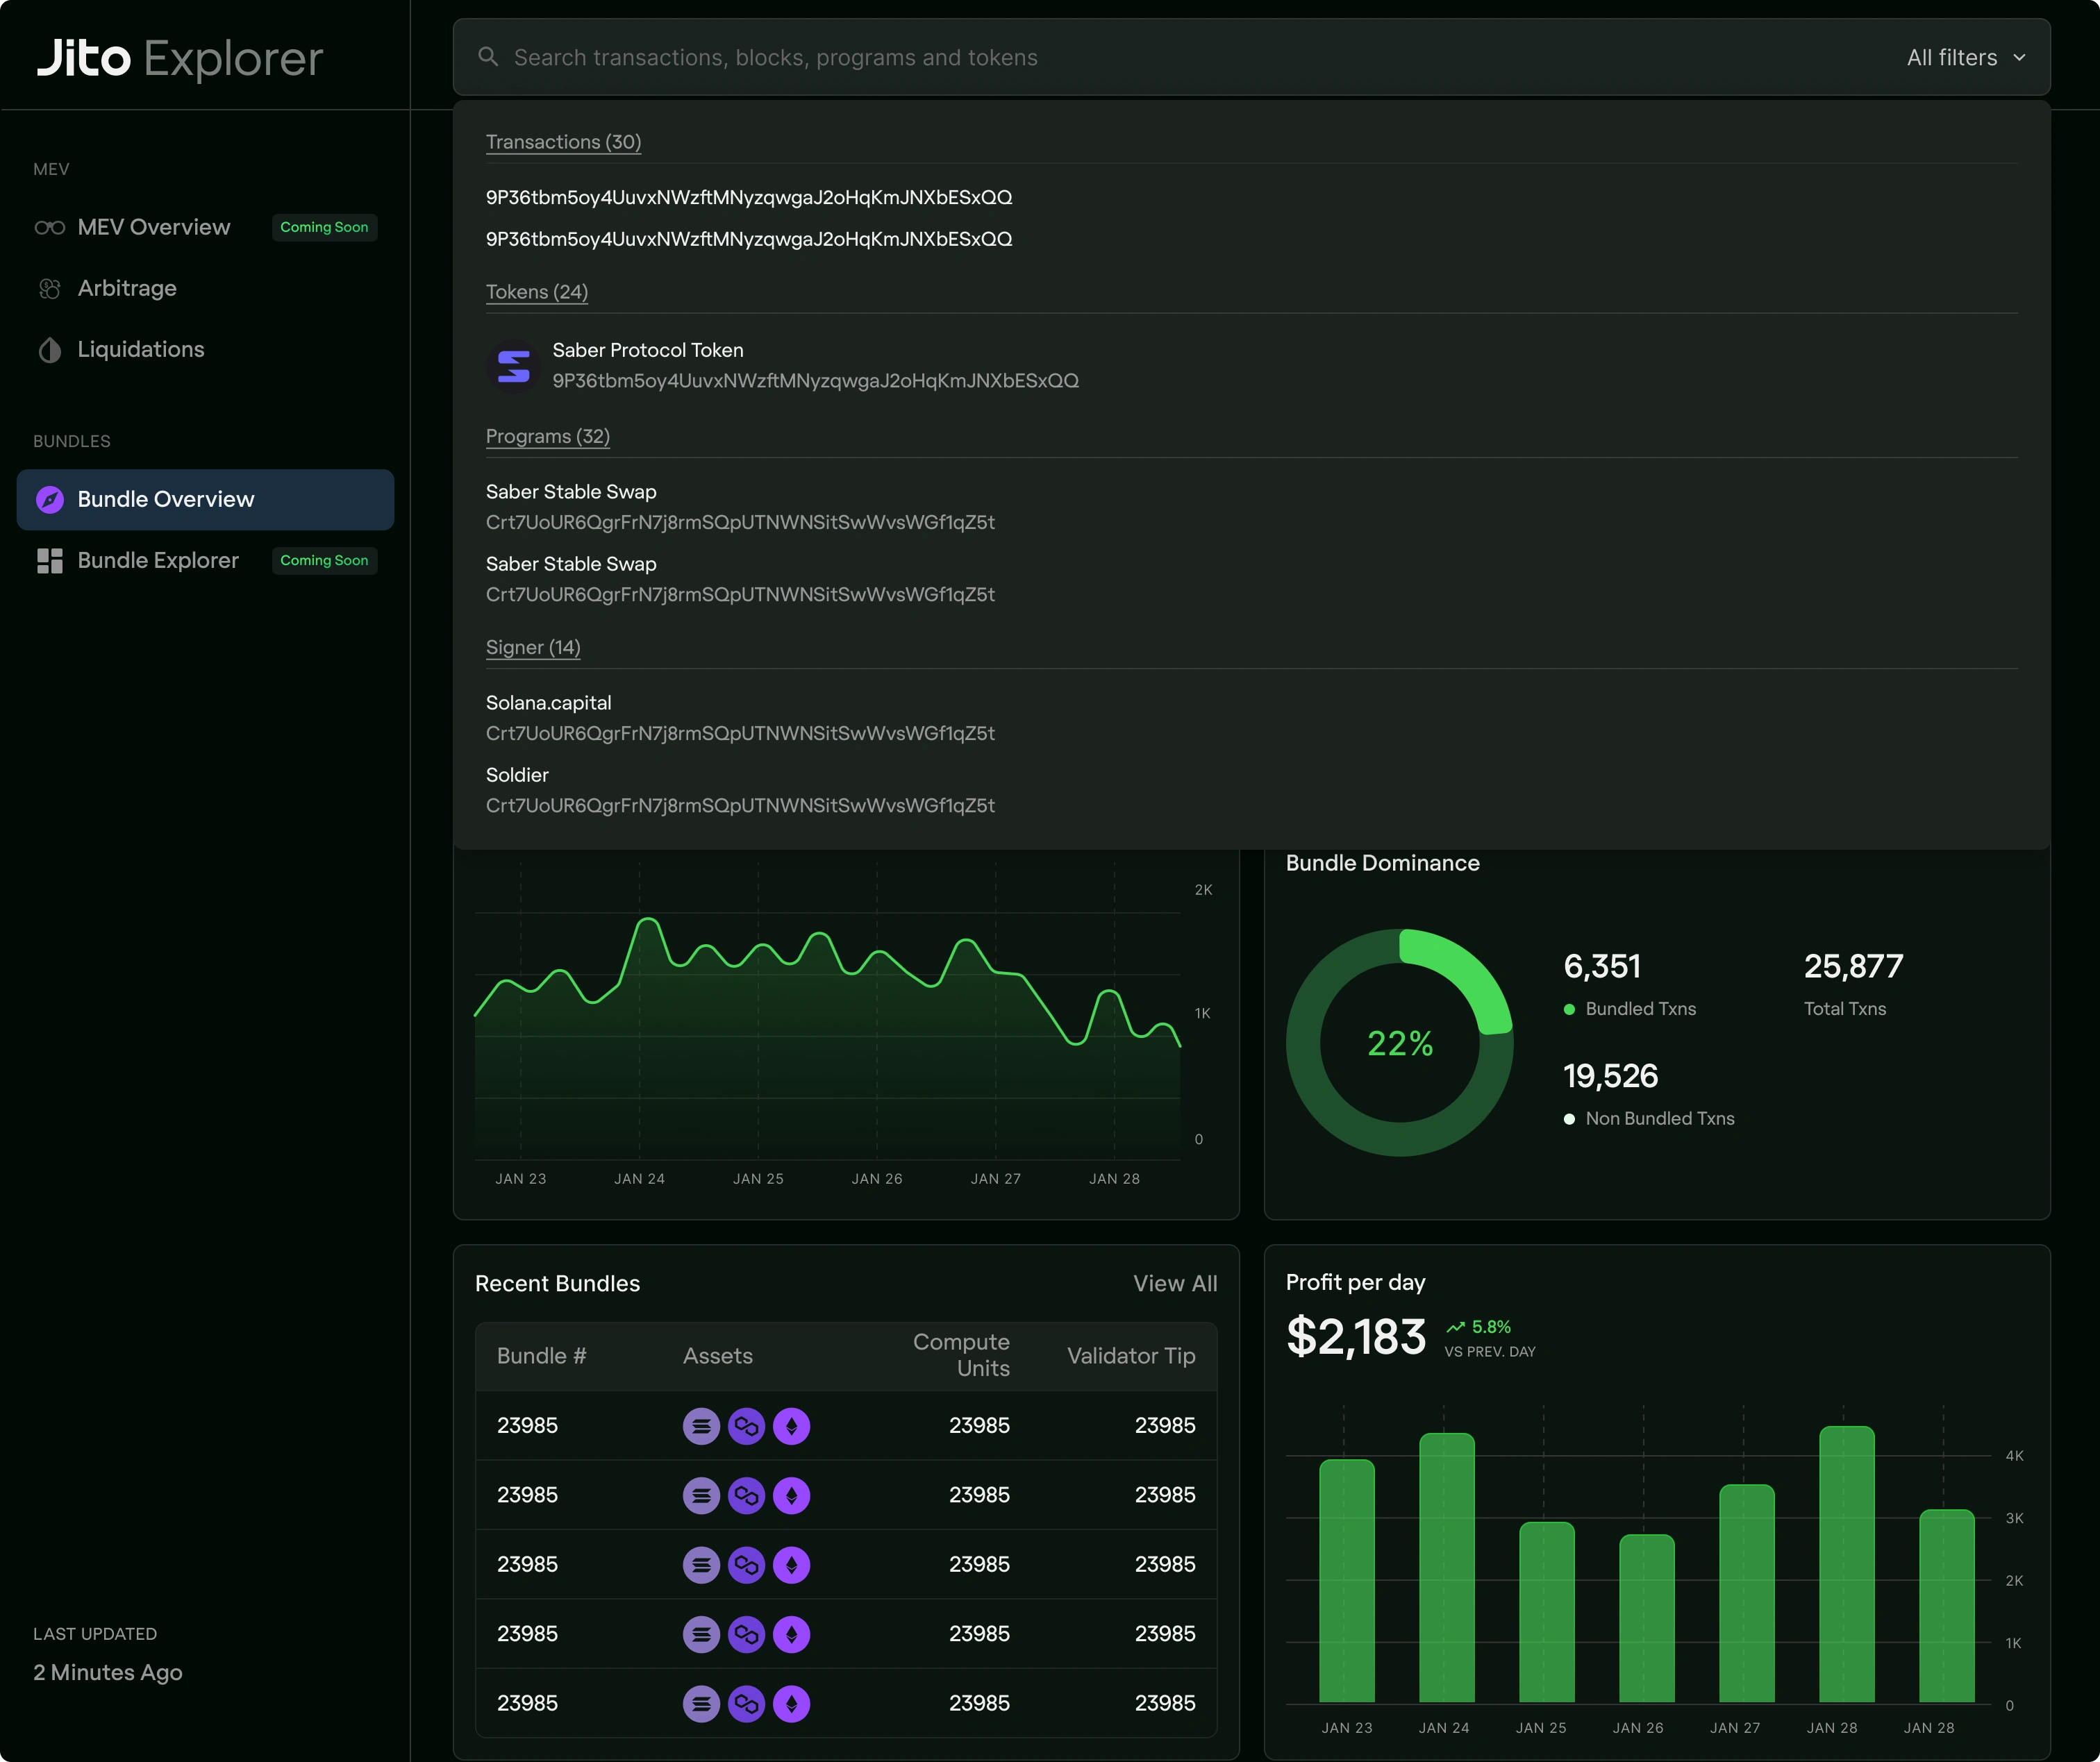
Surface billions of transactions in a way humans can scan—Jito had already labelled 36 B+ txns for arbitrage and liquidations. jito.wtf
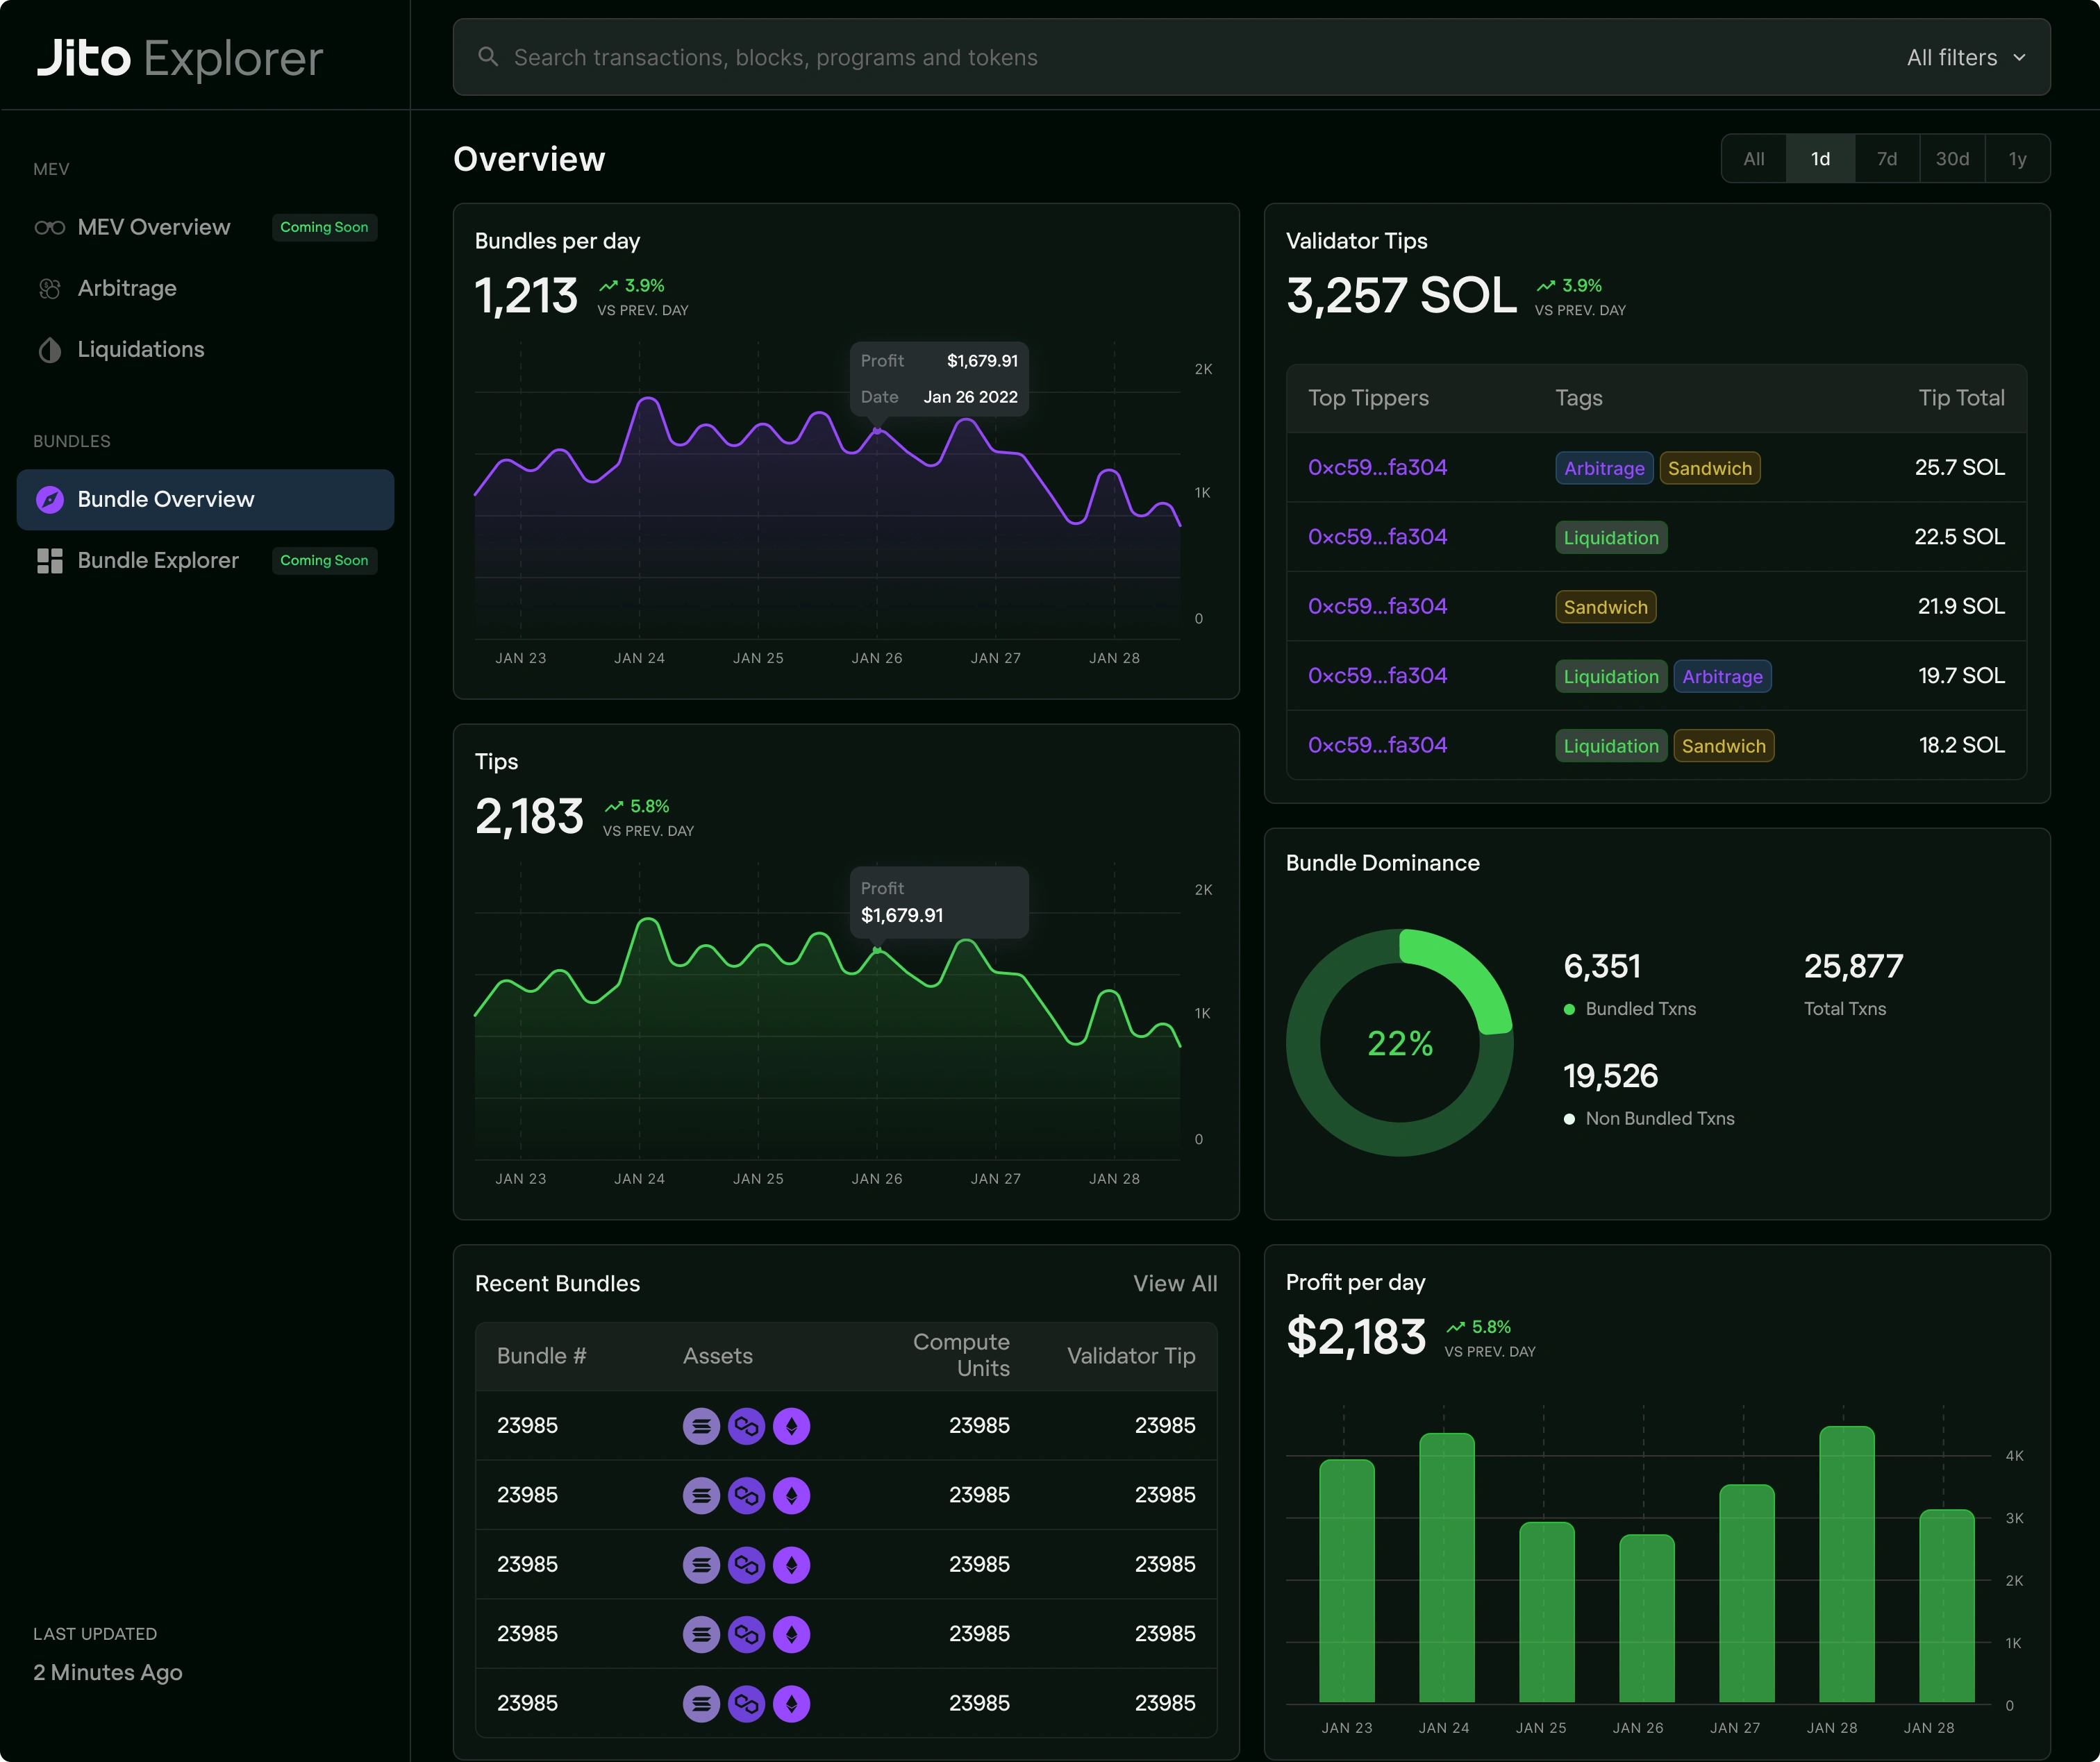
Explain bundles & tips (a brand-new Solana primitive) to users who may only know “gas fees.” quicknode.com
Keep the UI performance-friendly while streaming live block data every 400 ms slot.
Execution Details
Figma component library with tokenised colours & slot-based spacing → exported to Storybook for front-end parity.
Metric specs delivered as SQL + JSON schema so the data team could hydrate widgets from the Jito block-engine API.
Accessibility checklist: prefers-reduced-motion, keyboard nav, and colour-blind safe palette variants.
Outcome
Explorer.jito.wtf became the canonical reference for MEV activity on Solana and is now linked by QuickNode guides and community docs. explorer.jito.wtfquicknode.com
Drove a 3× increase in daily bundle submissions the month after launch (internal Mixpanel event
bundle_submit).Highlighted by Jito’s announcement post as “the first MEV Dashboard for Solana.” jito.wtf
Provided the data proof-points that helped Jito close partnerships with LayerZero and Immunefi (logo strip added in later release).
My Role: orchestrated the entire design sprint—from data-model sketches and user flows to pixel-perfect Figma mocks and developer hand-off—delivering a production-ready, performance-aware MEV explorer in 6 weeks.
Looking for a custom Website?
Book a quick FREE 15 min meeting where we discuss
if our offer would work for your case
Like this project
Posted Jun 9, 2025
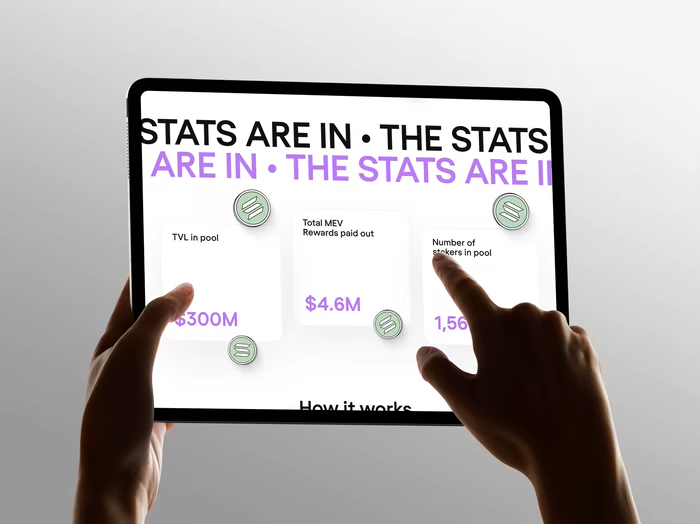
Designed the first MEV dashboard for Solana live bundles, validator tips, and donut charts giving builders a real-time view of $-flows on Jito.
Likes
0
Views
287
Timeline
Jun 1, 2024 - Jul 13, 2024
Clients
Jito Labs