Health Monitoring Dashboard
Cansaas Agency
Overview
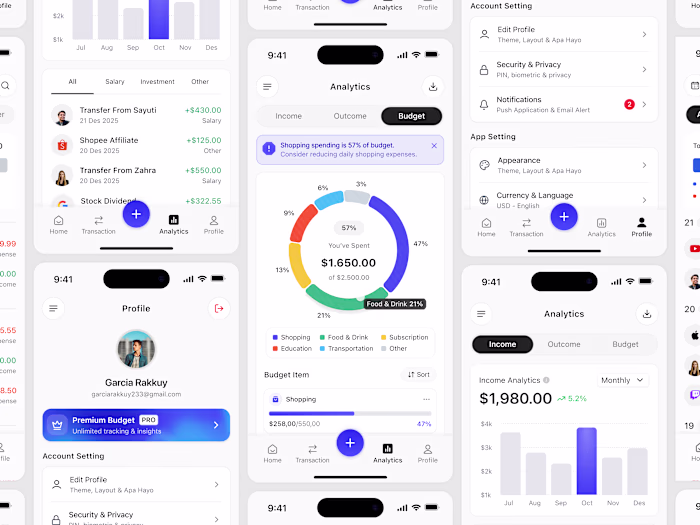
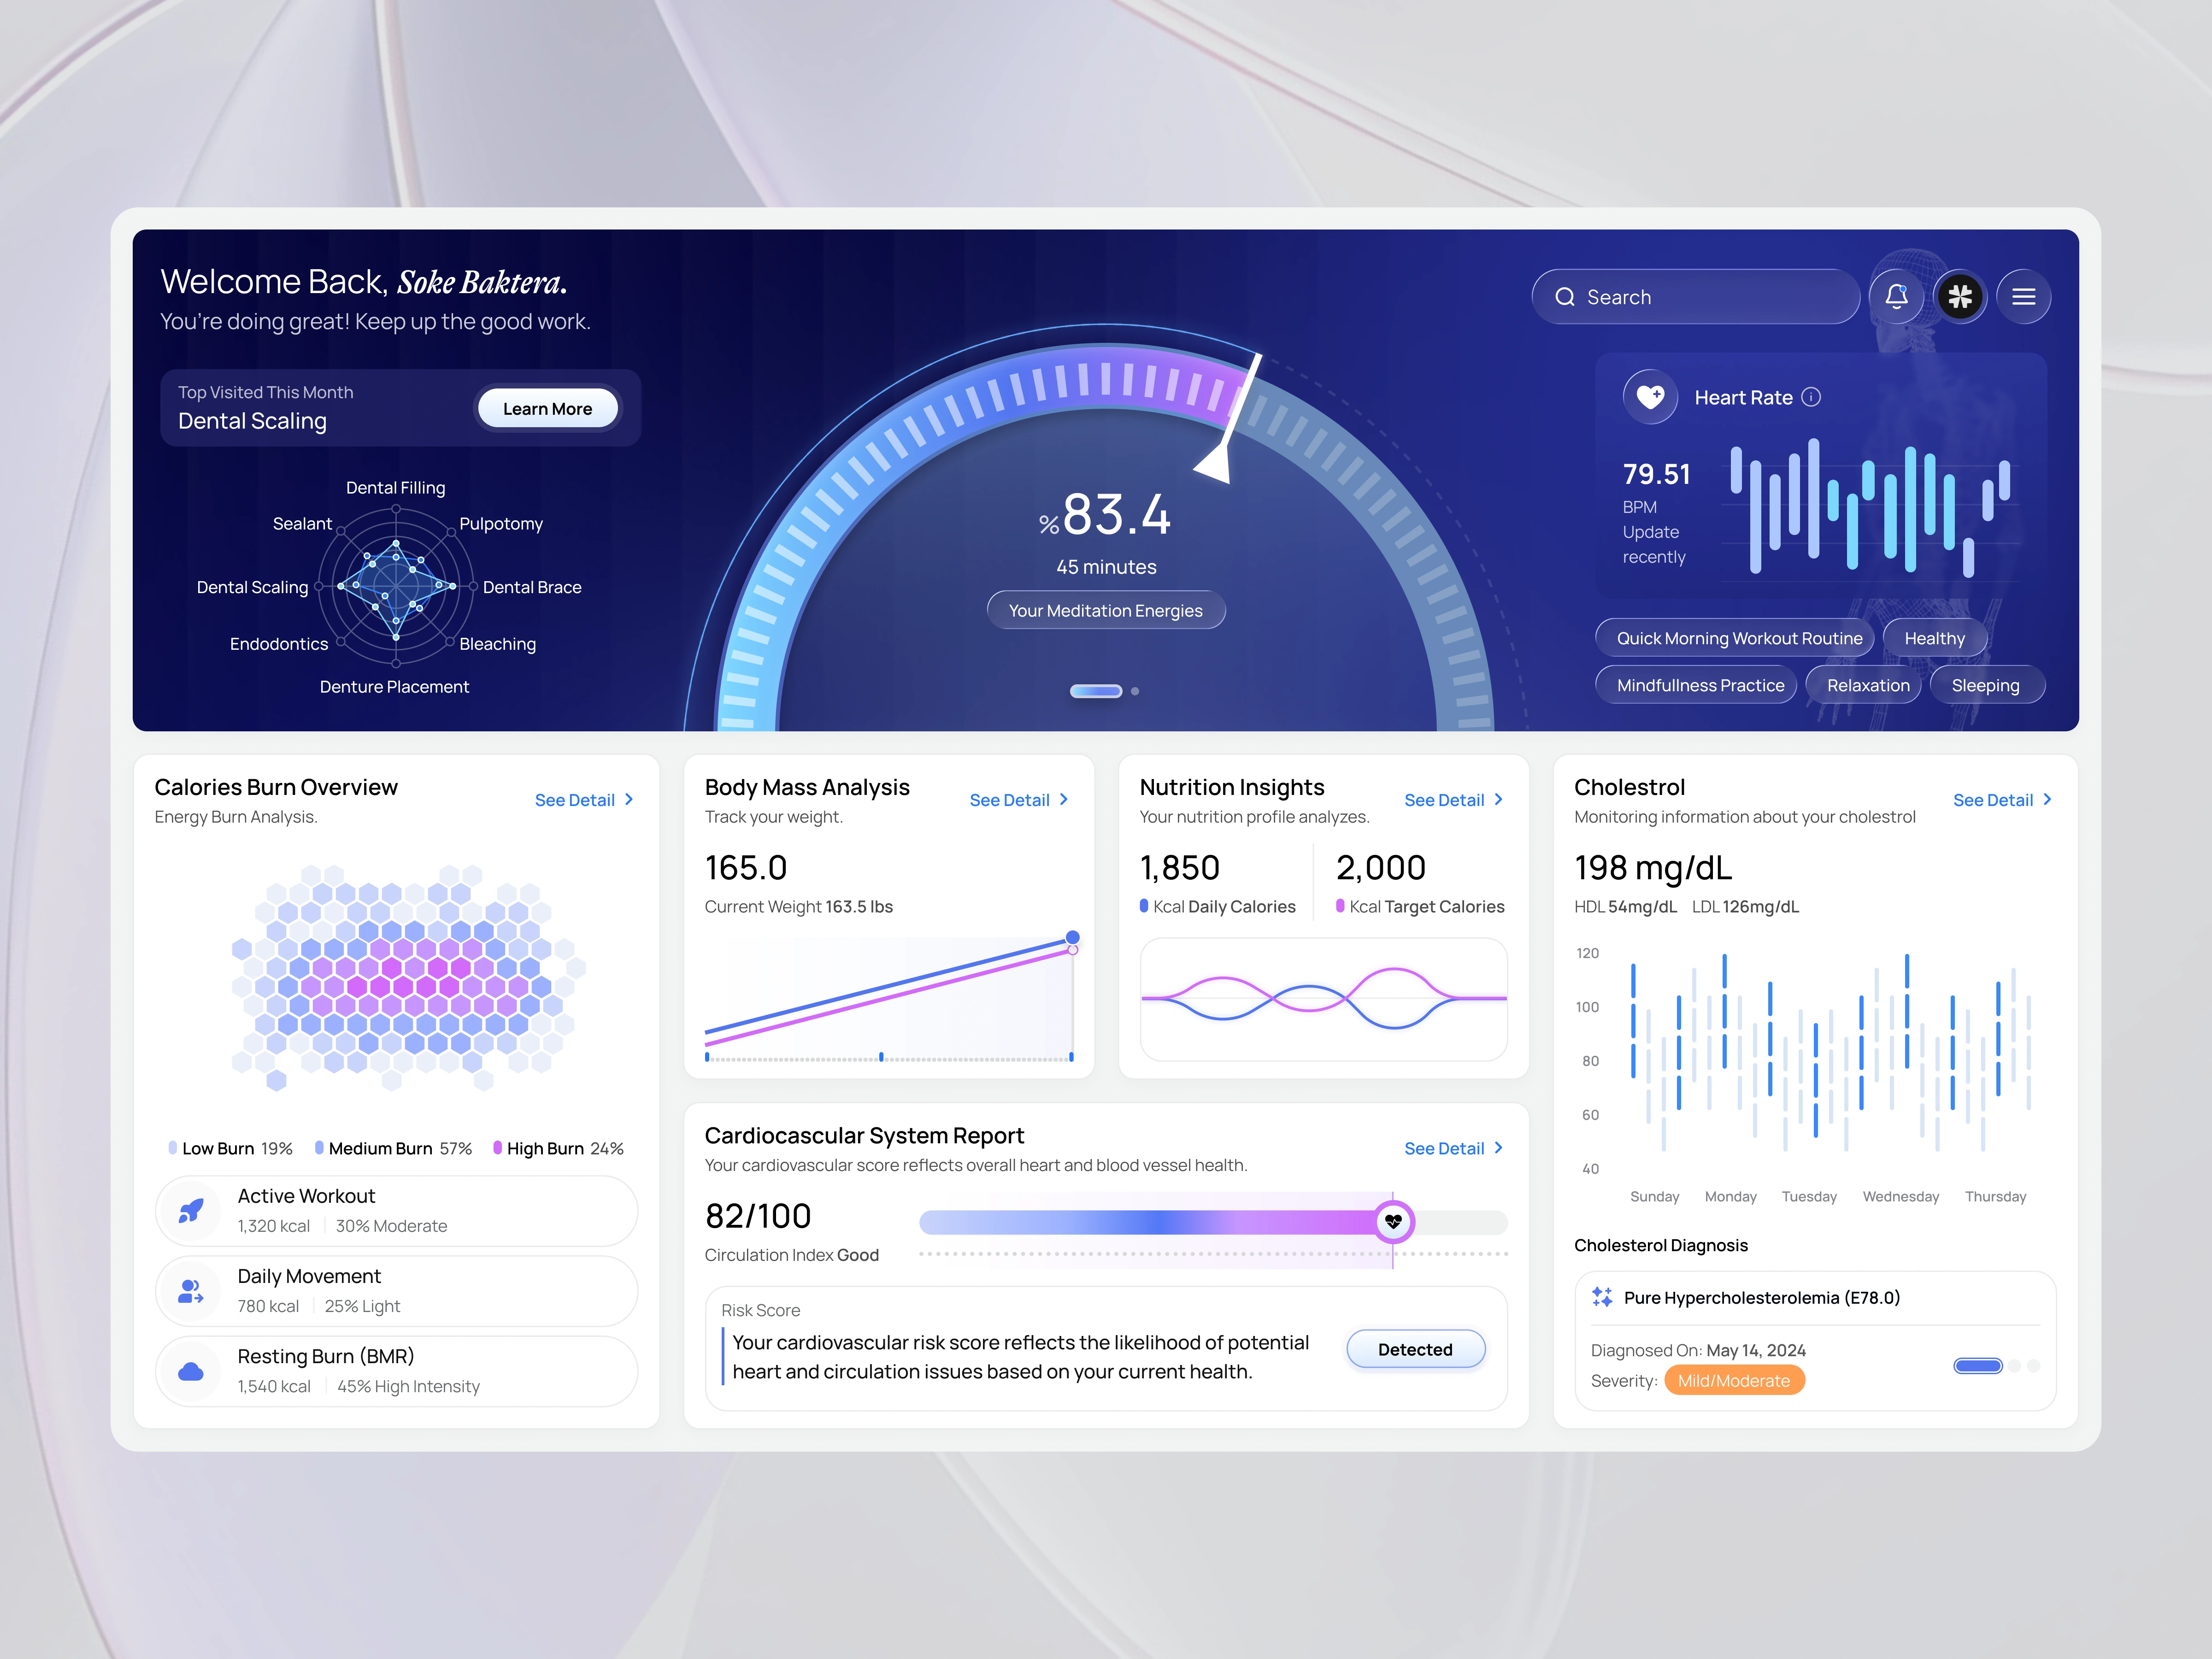
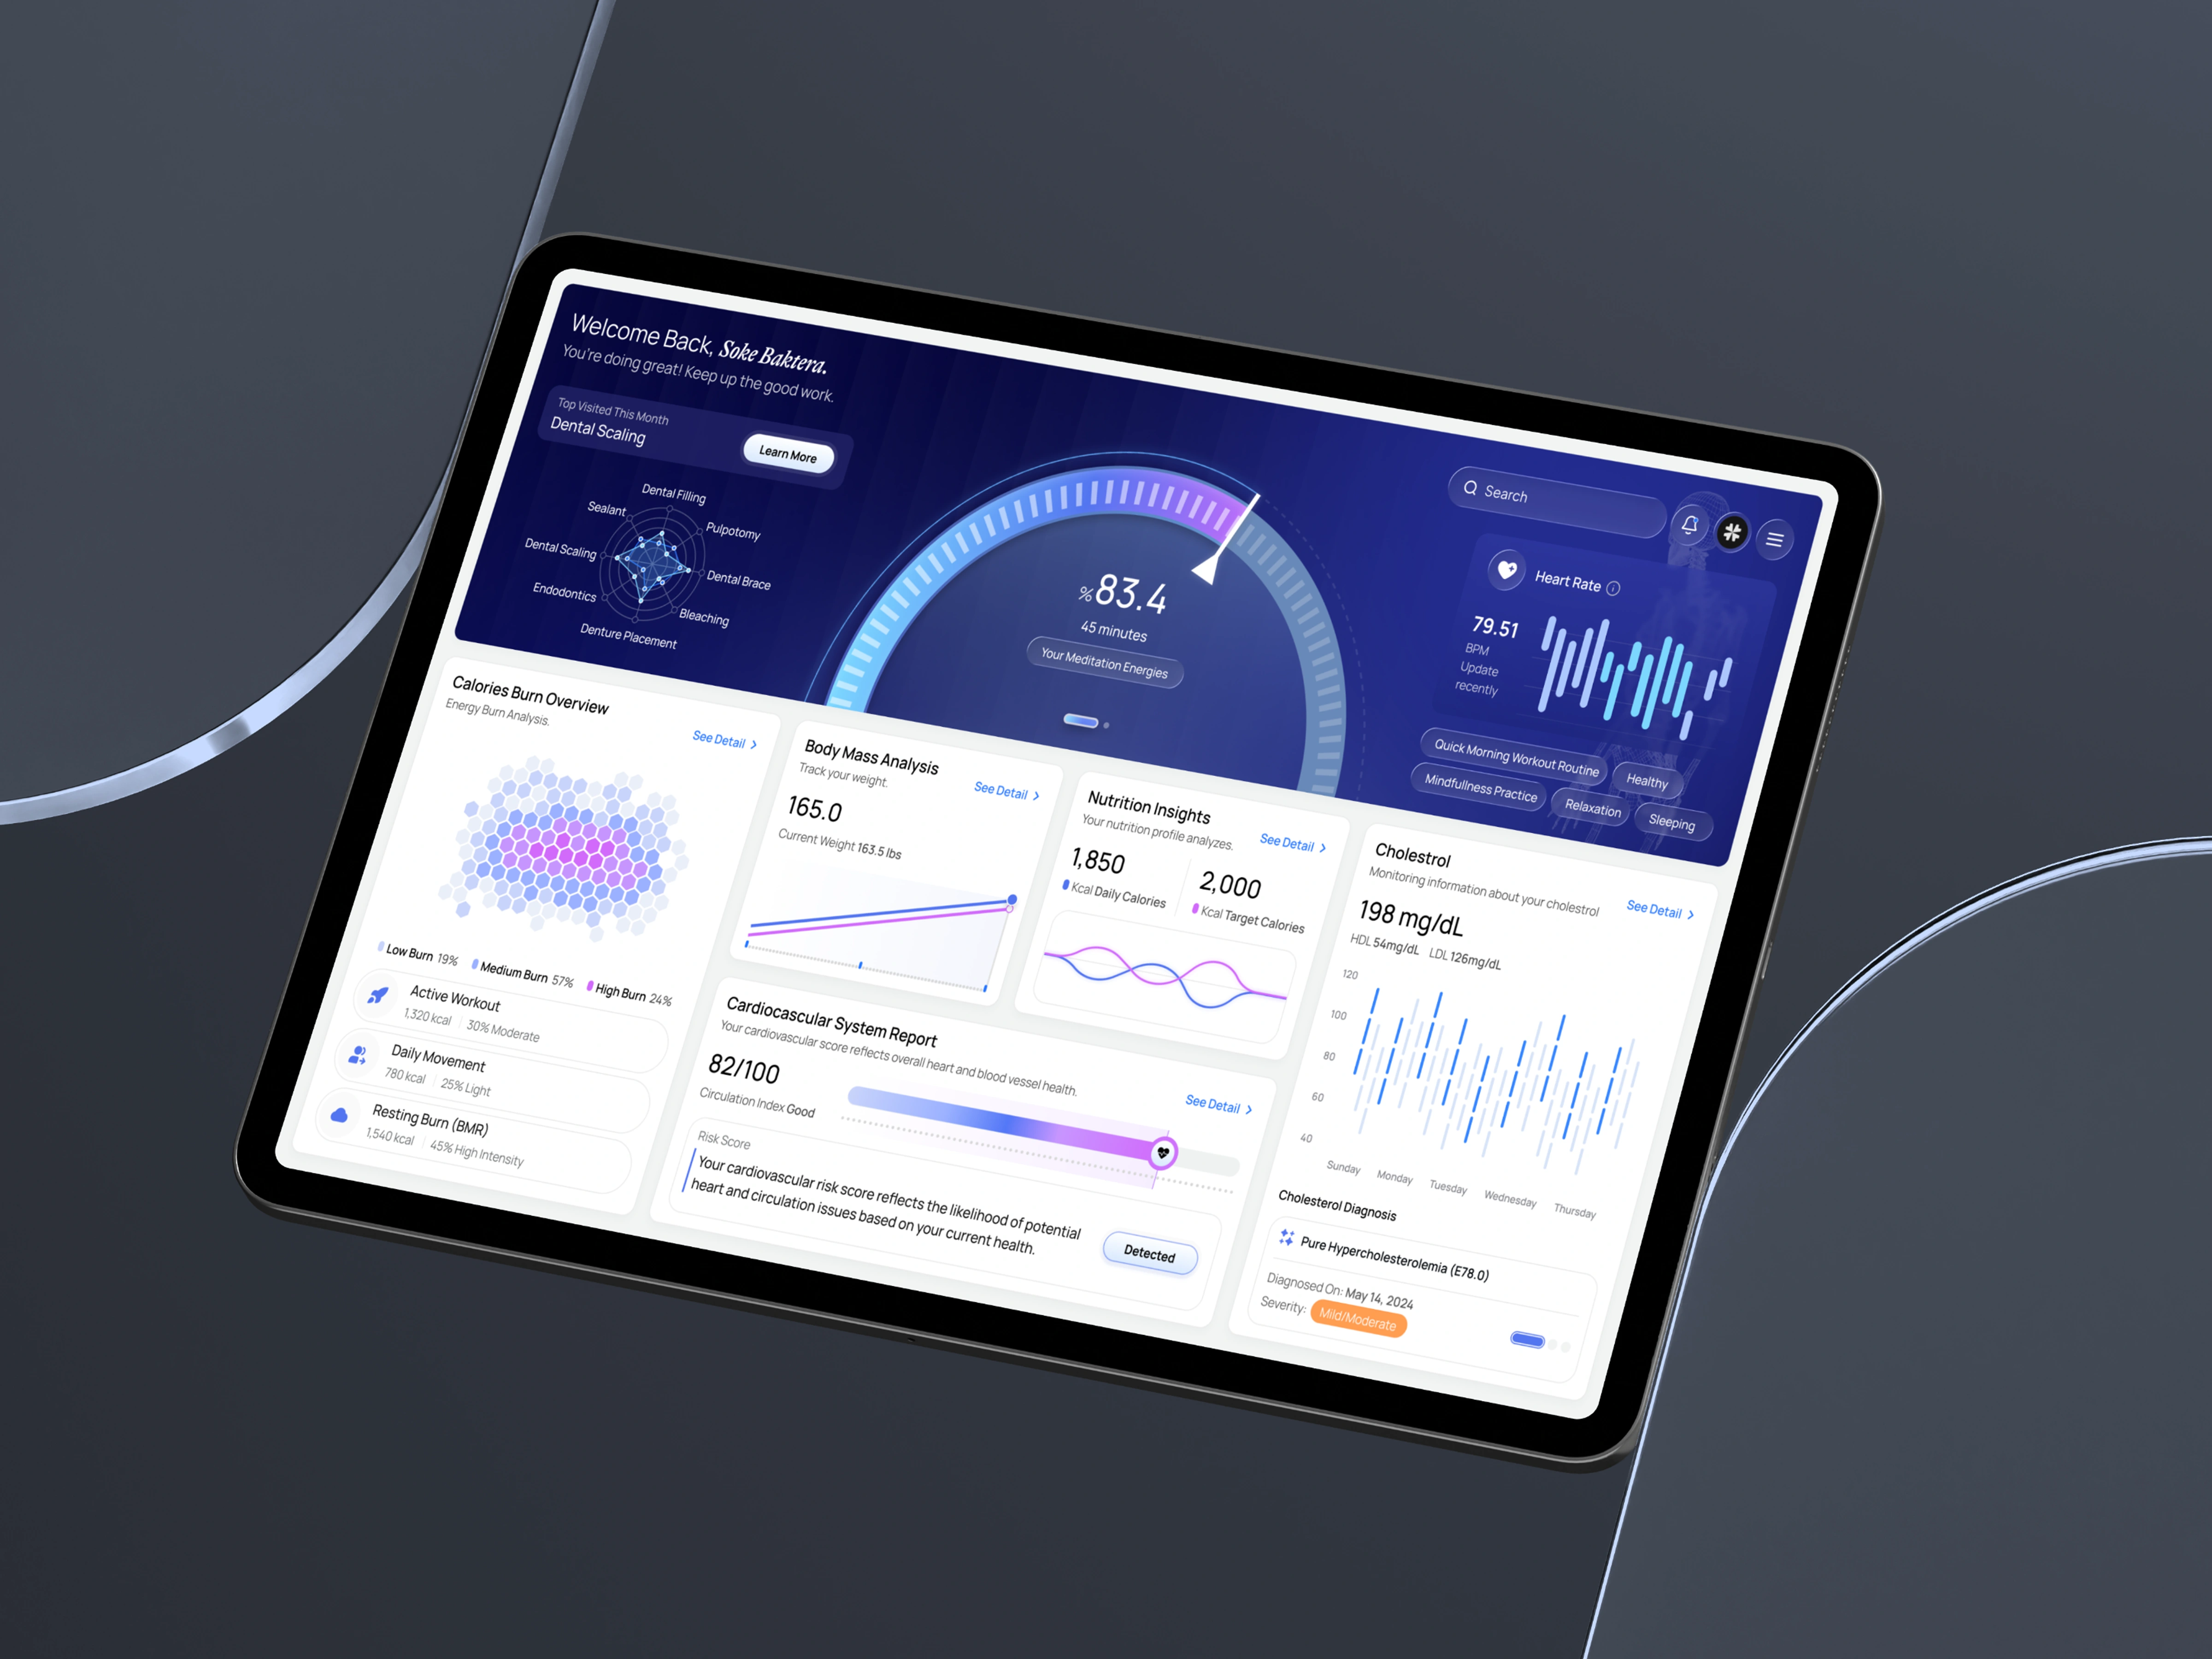
This Health Monitoring Dashboard is a modern healthcare analytics interface designed to transform complex medical data into a structured, intuitive digital experience. The system integrates heart rate tracking, cholesterol monitoring, body mass analysis, nutrition insights, calorie burn analytics, and cardiovascular scoring into a unified dashboard. Built with a clean modular layout and contemporary data visualization patterns, the design balances medical credibility with SaaS-level usability.
The Challenge
Healthcare dashboards often suffer from data overload, poor hierarchy, and fragmented visualization systems. Medical metrics such as HDL/LDL cholesterol levels, cardiovascular risk scores, biometric tracking, and calorie expenditure require clarity and contextual explanation. The challenge was to simplify dense health data without sacrificing accuracy, depth, or clinical relevance.
The Approach
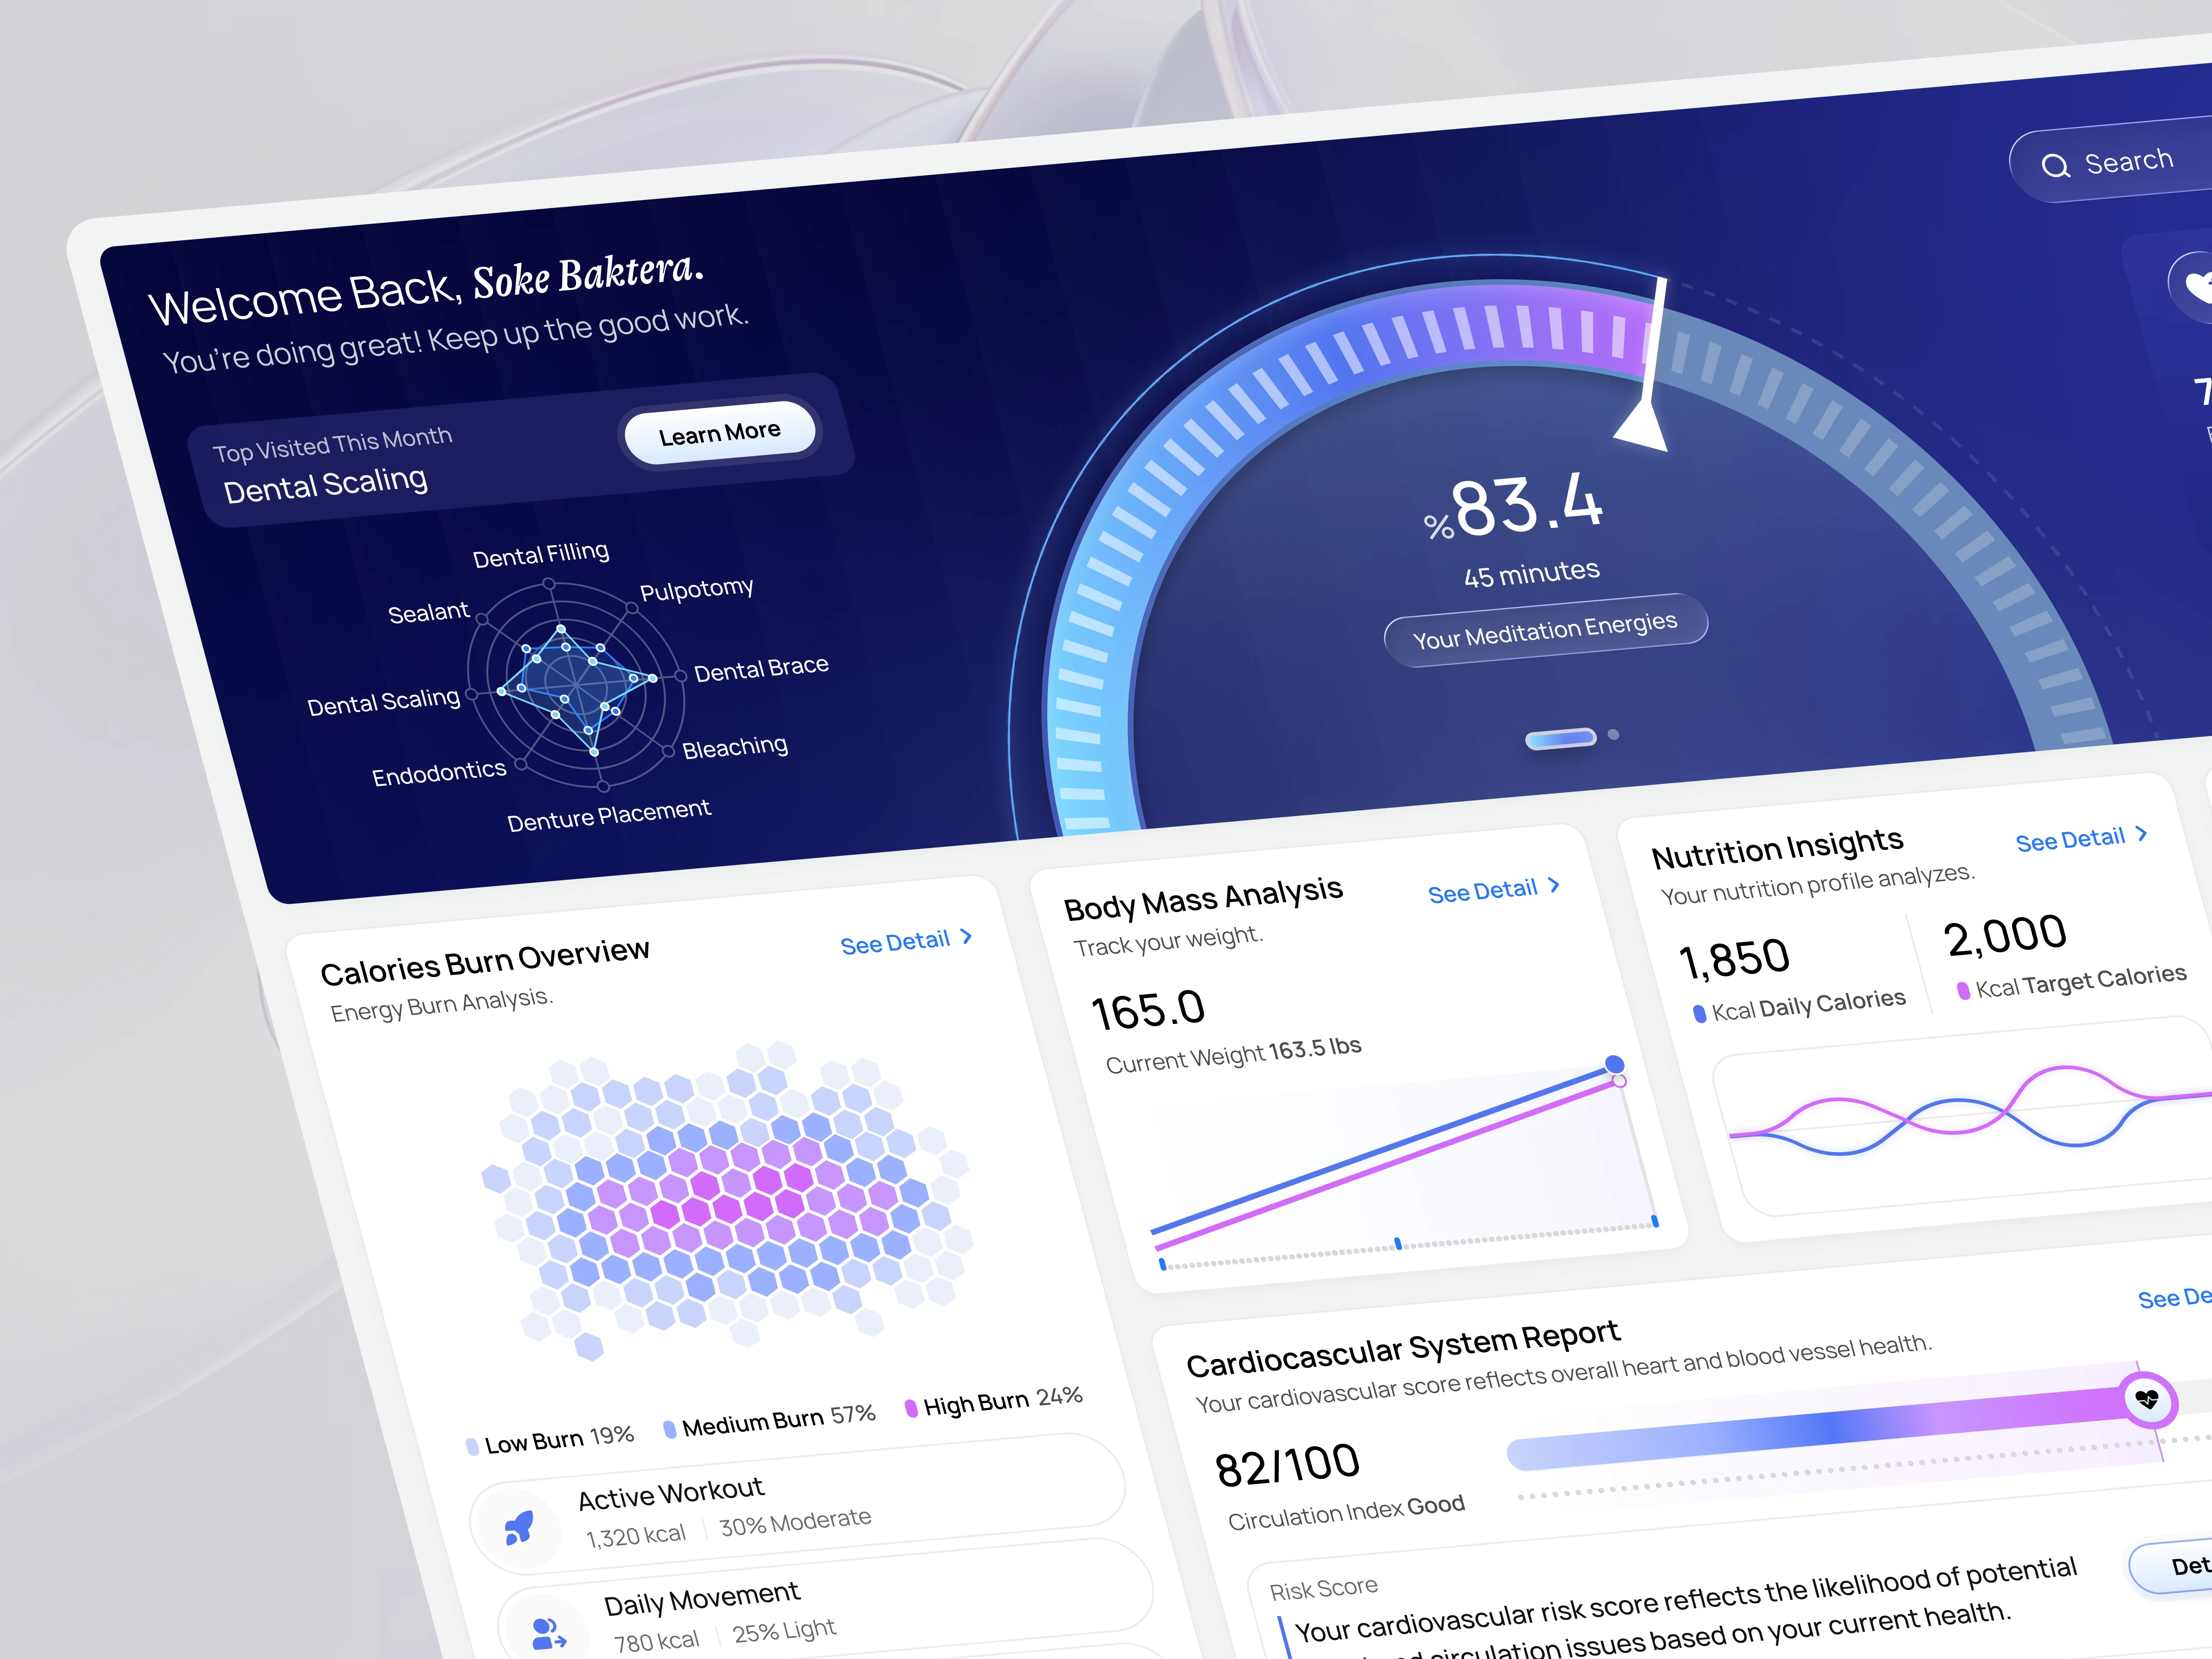
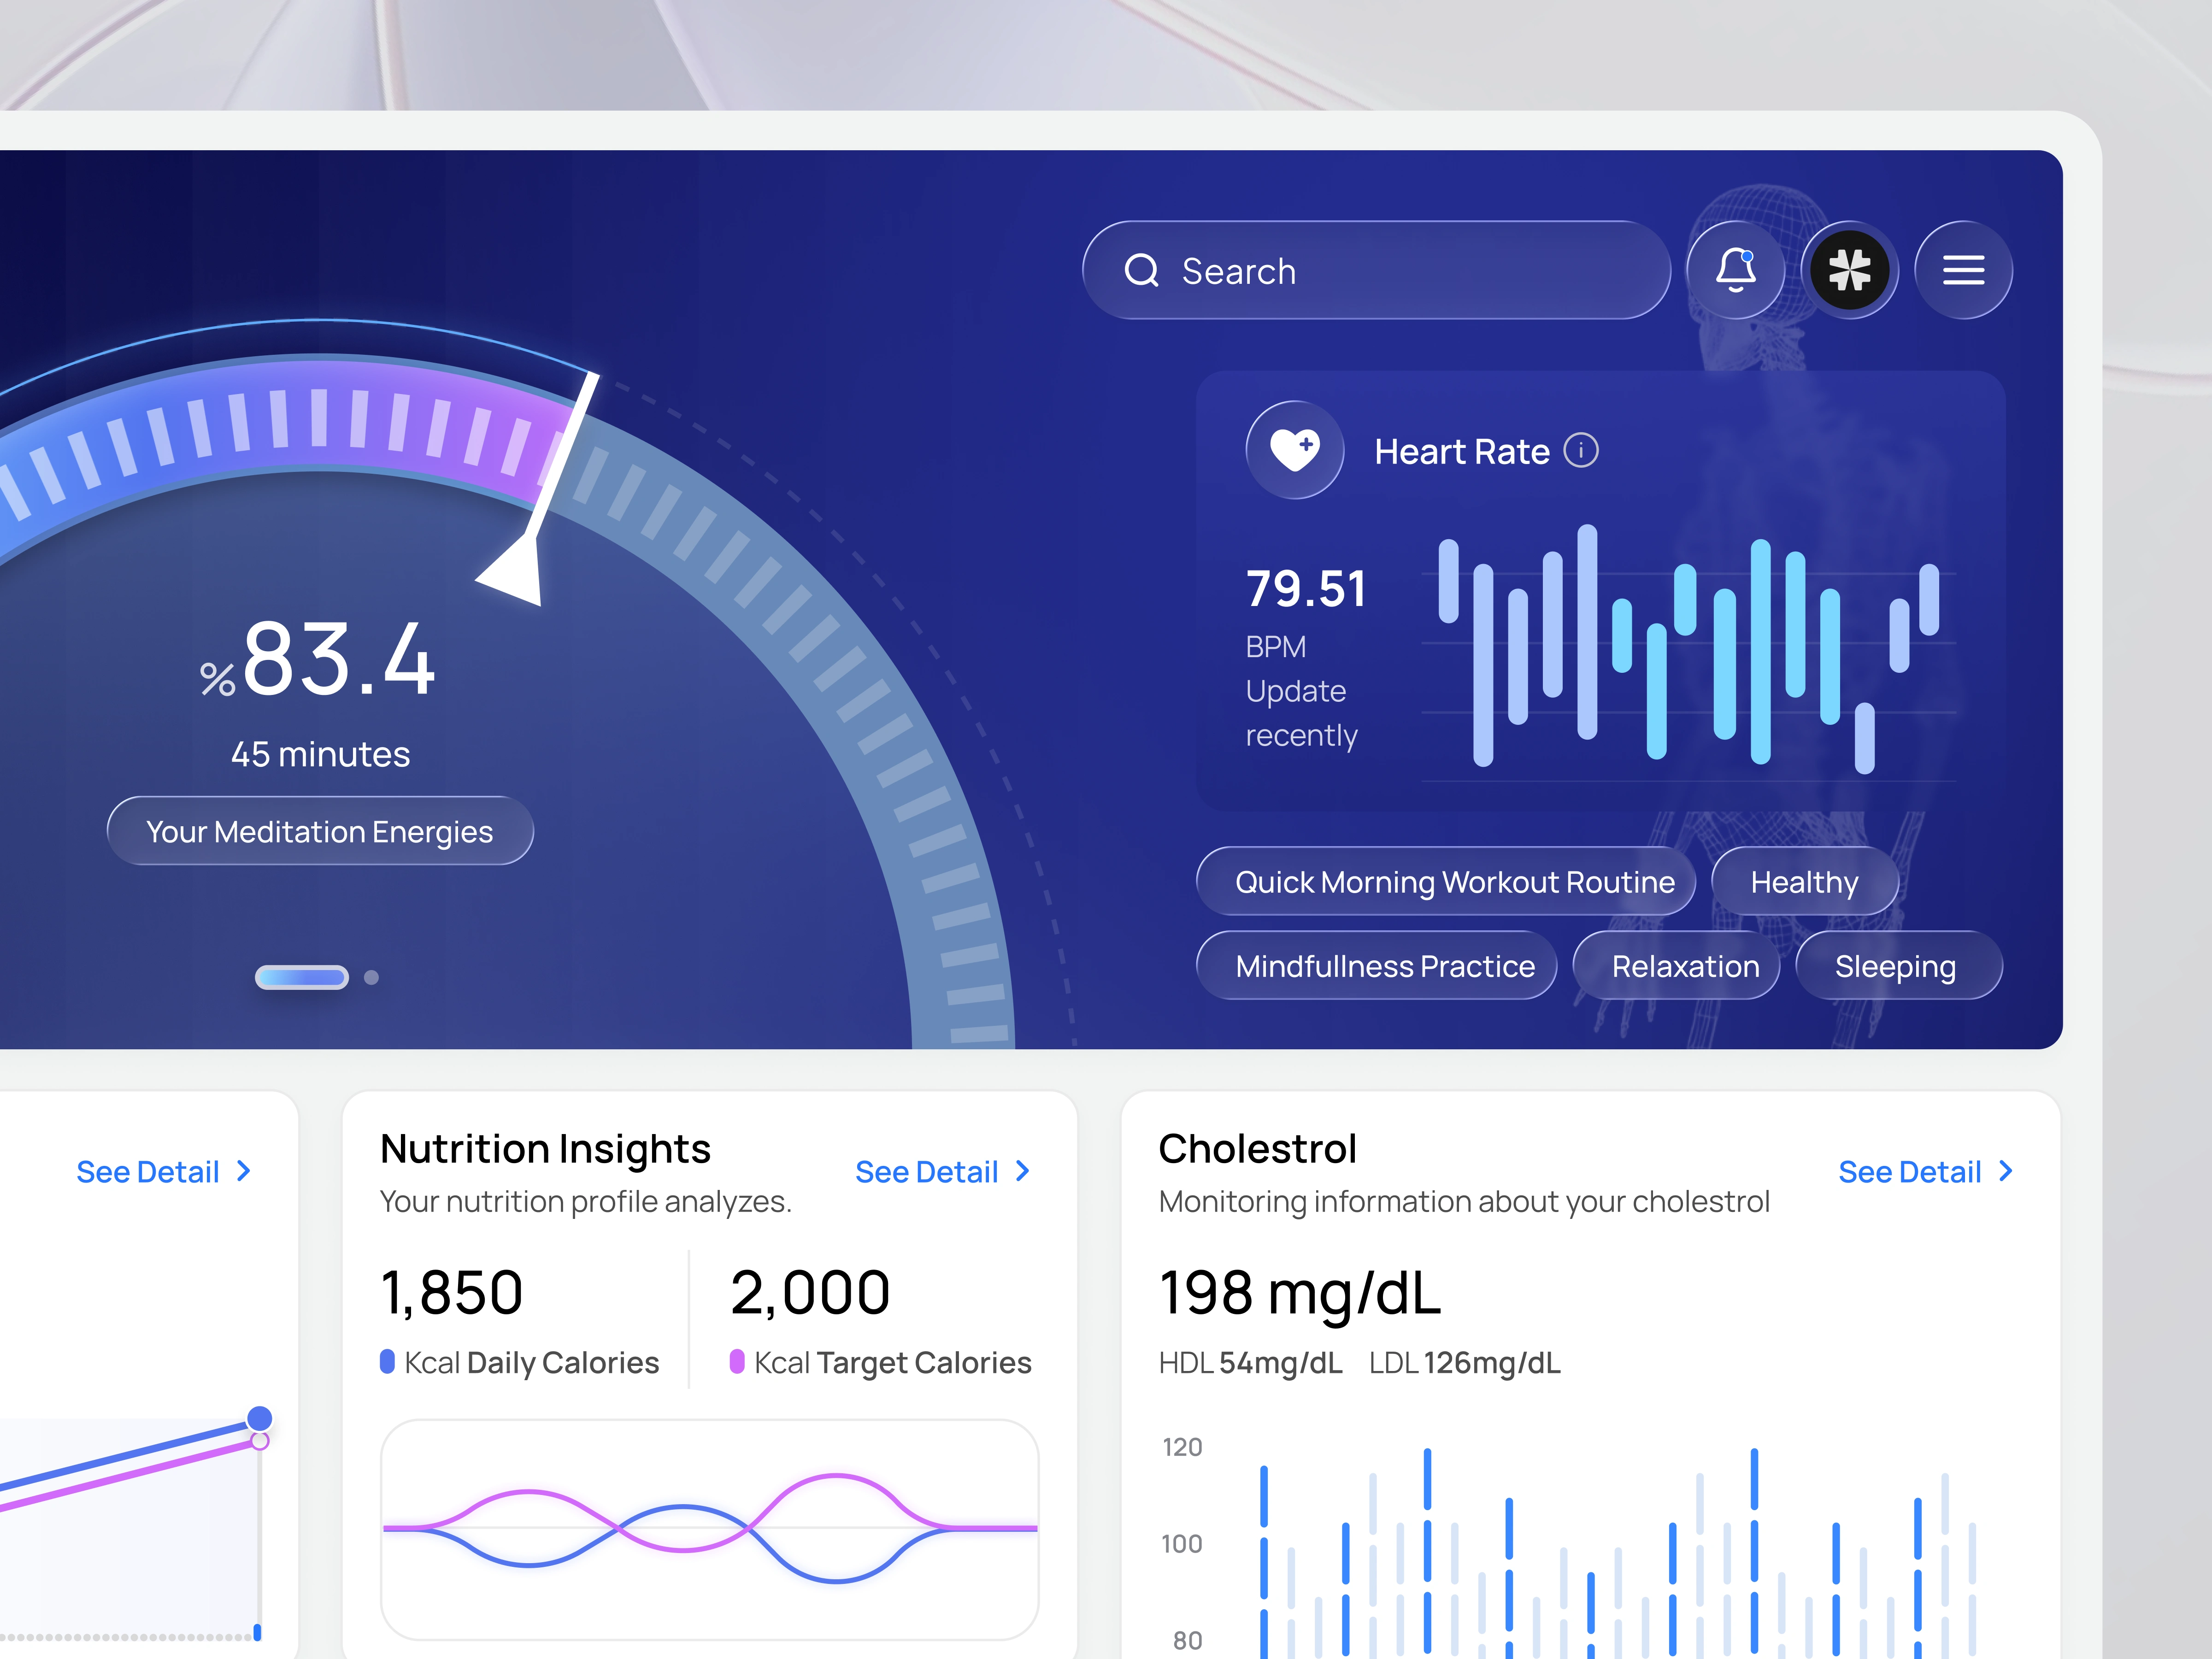
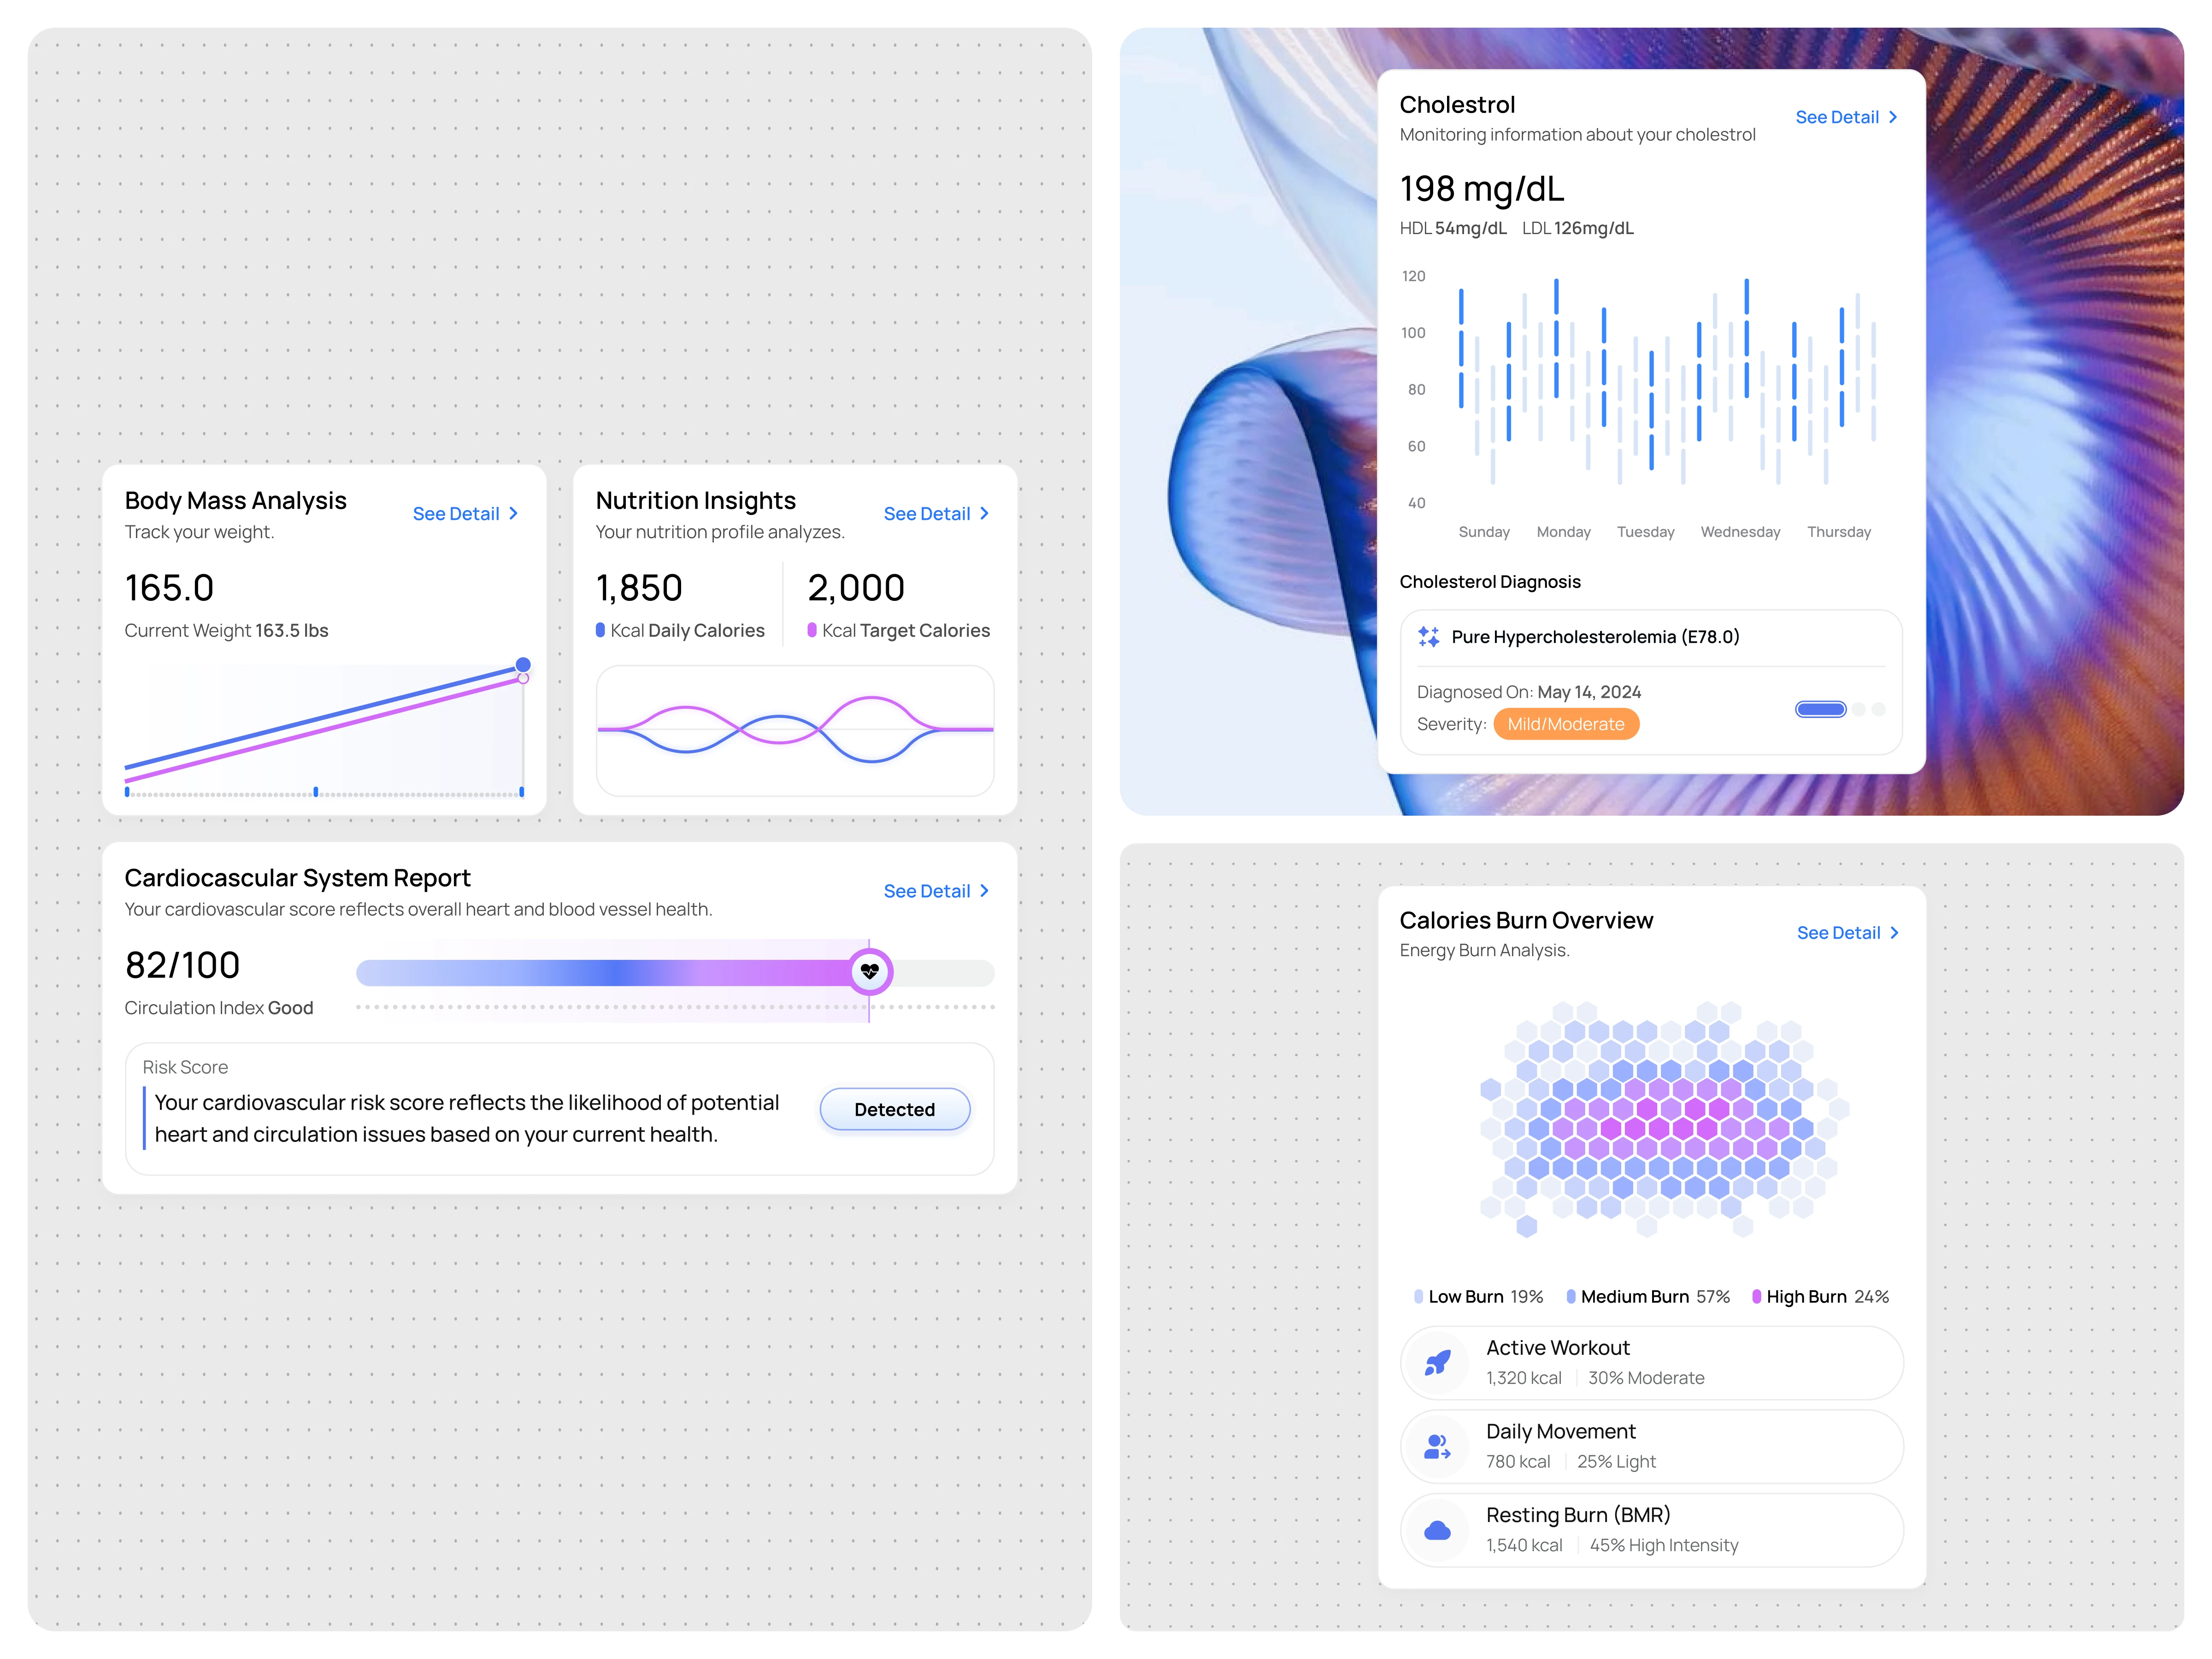
We structured the dashboard using a layered hierarchy system. The hero section highlights primary health performance indicators using a radial progress visualization combined with real-time biometric analytics. Supporting modules are organized into clean analytics cards featuring line charts, heatmap-style visualizations, gradient progress bars, and diagnostic summaries. Each card follows consistent spacing, rounded containers, and subtle shadows to enhance readability and reduce cognitive load.
Color psychology plays a key role in this healthcare UI design. Cool blue gradients reinforce trust and reliability, while purple accents introduce a modern digital health aesthetic. Micro-interactions and clear labeling improve navigation and ensure users can quickly scan and interpret critical health metrics.
User Experience & System Design
From a UX perspective, the interface prioritizes clarity, modularity, and scalability. Each health metric component is designed as a reusable analytics card, allowing the system to expand across web, tablet, and medical SaaS platforms. The grid structure maintains balance while ensuring responsive adaptability for multiple screen sizes.
The navigation flow supports quick data access while minimizing friction. Users can scan high-level performance indicators first, then drill down into detailed health reports, improving both engagement and usability.
Impact & Value
This Health Monitoring Dashboard demonstrates how modern healthcare UI/UX design can elevate digital wellness platforms. By combining structured data visualization, clinical reporting elements, and intuitive interaction patterns, the system improves data comprehension and enhances user confidence.
The result is a scalable medical dashboard design that bridges healthcare analytics, wellness technology, and SaaS product standards into one cohesive digital experience.
Like this project
Posted Feb 24, 2026
Modern Health Monitoring Dashboard with clear data visualization, biometric tracking, and clinical analytics designed for scalable healthcare SaaS platforms.
Likes
0
Views
21