Enhanced Business Insights - Walmart Sales Dashboard (Power BI)

Tushar sharma


I created this interactive Walmart Sales Dashboard to analyze and visualize key business metrics, helping in data-driven decision-making. Here are some insights:
🔹 Total Sales: $1.57M
🔹 Total Profit: $175.26K
🔹 Total Quantity Sold: 22K
🔹 Average Delivery Days: 4
📌 Key Findings:
✅ Sales by Segment: The Consumer segment (48%) leads in sales, followed by Corporate (33%) and Home Office (19%).
✅ Regional Performance: The West region (33%) generates the highest sales, while the South (16%) lags.
✅ Top-Selling Categories: Office Supplies ($0.64M) outperform Technology ($0.47M) and Furniture ($0.45M).
✅ Sales Trend Analysis: Sales and profits peak in November and December, likely due to holiday shopping.
✅ Shipping Mode Impact: Standard Class (0.33M) is the most preferred shipping mode, while Same Day (0.03M) is the least used.
💡 This dashboard helps businesses optimize sales strategies, track performance, and improve logistics.
📈 Need a custom Power BI dashboard for your business? Let’s connect! 💬
#PowerBI #DataAnalytics #SalesDashboard #Freelance #DataVisualization #BusinessIntelligence #WalmartAnalytics
Like this project
Posted Feb 15, 2025
Tushar created an advanced Power BI dashboard that transformed raw data into actionable business insights, helping clients make informed decisions.
Likes
0
Views
0
Clients
Walmart


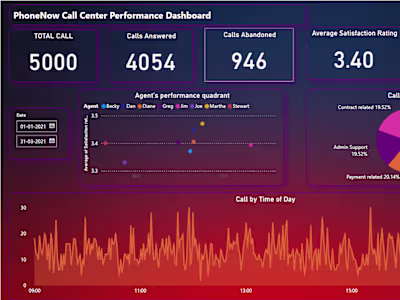
Call Center Performance Dashboard | PwC Power BI
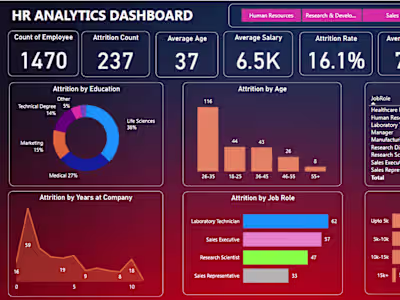
Creative Data Visualization for Improved HR Operations