Call Center Performance Dashboard | PwC Power BI

Tushar sharma


The PwC Power BI Virtual Case Experience on Forage, I developed an interactive Call Center Performance Dashboard to enhance operational efficiency and customer experience.
🔍 Key Metrics & Insights:
✅ 5000 Total Calls – Understanding customer demand.
✅ 4054 Calls Answered – Measuring agent efficiency.
✅ 946 Calls Abandoned – Identifying service gaps.
✅ 3.40 Avg. Satisfaction Rating – Monitoring customer sentiment.
✅ 67.52 sec Speed of Answer – Evaluating response times.
📊 Dashboard Visuals & Their Impact:
📌 Agent Performance Quadrant (Scatter Plot) – Highlights top-performing agents & coaching opportunities.
📌 Calls by Topic (Pie Chart) – Categorizes customer inquiries for better issue resolution.
📌 Call Trends by Time of Day (Line Chart) – Helps optimize staffing during peak hours.
💡 Key Takeaways from the Project:
🔹 Data-driven workforce allocation to minimize call abandonment.
🔹 Enhancing customer support strategy based on common query topics.
🔹 Using Power BI’s visual analytics to make informed business decisions.
🔹 Leveraging automation & AI tools for improved customer experience.As part of the PwC Power BI Virtual Case Experience on Forage, I developed an interactive Call Center Performance Dashboard to enhance operational efficiency and customer experience.
🔍 Key Metrics & Insights:
✅ 5000 Total Calls – Understanding customer demand.
✅ 4054 Calls Answered – Measuring agent efficiency.
✅ 946 Calls Abandoned – Identifying service gaps.
✅ 3.40 Avg. Satisfaction Rating – Monitoring customer sentiment.
✅ 67.52 sec Speed of Answer – Evaluating response times.📊
Impact:
📌 Agent Performance Quadrant (Scatter Plot) – Highlights top-performing agents & coaching opportunities.
📌 Calls by Topic (Pie Chart) – Categorizes customer inquiries for better issue resolution.
📌 Call Trends by Time of Day (Line Chart) – Helps optimize staffing during peak hours.
💡 Key Takeaways from the Project:
🔹 Data-driven workforce allocation to minimize call abandonment.
🔹 Enhancing customer support strategy based on common query topics.
🔹 Using Power BI’s visual analytics to make informed business decisions.
🔹 Leveraging automation & AI tools for improved customer experience.
Skills: Microsoft Power BI · Power BI · Data Visualization · Data Cleaning · Data Analytics · Data Analysis · Exploratory Data Analysis · Customer Experience Analysis · KPI Dashboards · Dashboards · Dashboards Designs
Like this project
Posted Feb 15, 2025
With two years of industry experience,Tushar crafted detailed reports with actionable recommendations,showcasing ability to leverage data analytics effectively.
Likes
0
Views
0
Clients
PwC


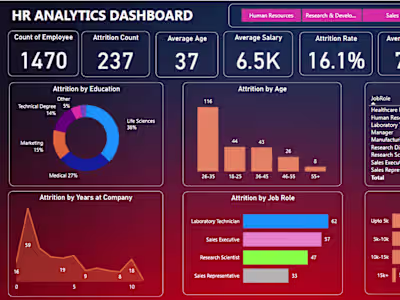
Creative Data Visualization for Improved HR Operations
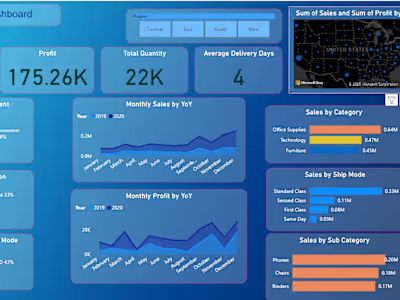
Enhanced Business Insights - Walmart Sales Dashboard (Power BI)