Redesigning Grid Singularity's P2P Energy Trading Tool
Estefani Mauro
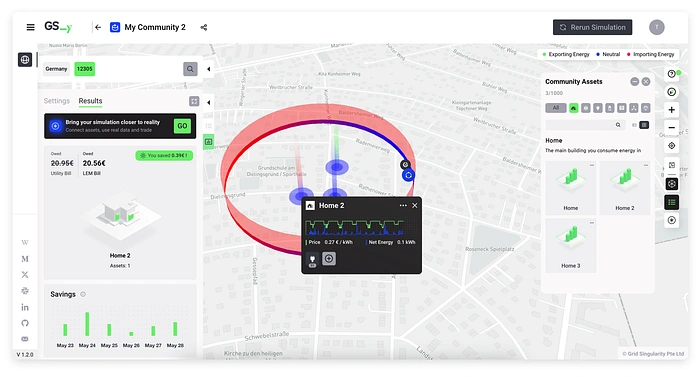
Singularity Map
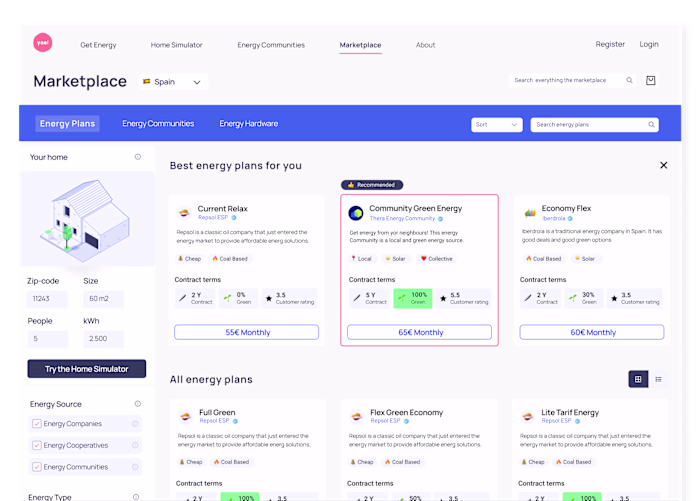
A Marketplace Solution for P2P Energy Trading (B2B-B2C)
About Grid Singularity
Grid Singularity is a legacy company originating from the Energy Web Foundation.
🎯 Goal: Build a marketplace for peer-to-peer (P2P) energy trading.
💡 How: Through a web-based energy simulation tool that provides insights into how to optimize the energy setup of any household or business.
⚡ Mission: Make renewable energy more accessible while empowering consumers to make better use of their energy resources.
⛓️ Technology: Blockchain to facilitate secure and transparent transactions.
Context and Project Overview
❗Problem: Grid Singularity had an existing tool called d3a.io. While functional, its UI was overly technical and not user-friendly, making it inaccessible to non-experts and blocking a public launch.
I joined Grid Singularity as a full-time Product Designer in July 2020 to help redesign the tool for broader adoption.
📋 Agenda — What This Case Study Covers:
Background & Team Setup — Context, challenges, and team structure.
My Role & Collaboration — Responsibilities and cross-functional work.
Project Scope & Goals — Business objectives, user needs, and KPIs.
Research & Insights — Methods, findings, and design inspiration.
Design Decisions — How research-informed solutions.
Usability Testing & Iterations — Testing process and refinements.
Constraints & Trade-offs — Key limitations and prioritization.
Final Outcome & Impact — Results and lessons learned.
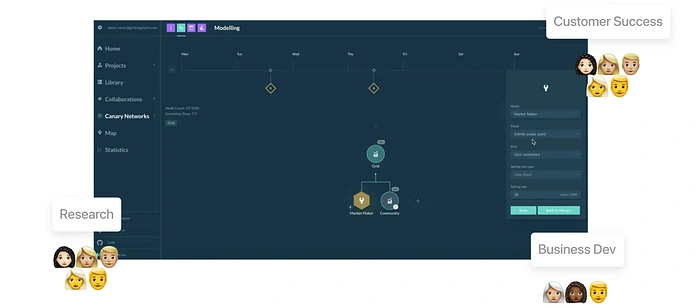
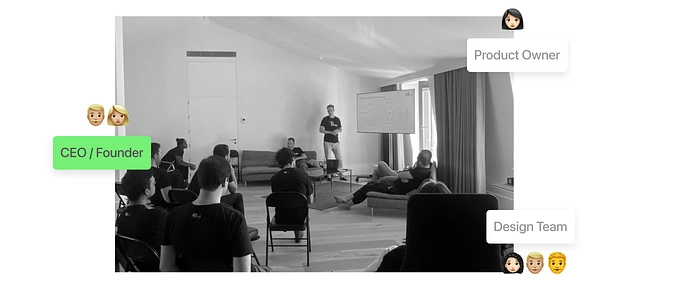
Team Structure and Cross-Collaboration
Teams Involved:
🎨 Design
💼 Business Development
🔬 Research
💻 Frontend Development
⛓️ Blockchain Engineering
🤝 Partnerships
🎯 Customer Success
Design Team: Lead Designer, Product Designer (me), and Junior Designer (focused on marketing and branding).
My Role & Responsibilities
My role combined strategic and hands-on responsibilities:
🧠Participated in workshops with the CEO, Product Owner, and Research Team to define the relaunch strategy.
🤝Worked closely with the Lead Designer on design decisions, project scoping, and breaking down user stories.
🎯 Developed features that aligned design decisions with business objectives.
Cross-Collaboration
Collaboration with other teams took place through weekly sessions, workshops, and ad-hoc brainstorming.
These teams had deep knowledge of the legacy product (operating for three years) and maintained direct contact with users via the Slack community and live demos.
💬 For example, Business Development moderated a Slack channel that served as a community hub. While they had valuable user insights, they lacked a process for translating this qualitative data into actionable improvements — this is where the Design Team added value.
Project Scope & Goals
Unique Challenges
🧩 Business Development & Customer Success: “Building an energy platform community is too complex for the average user.”
📜 Regulation & Law: Community members struggled to navigate the complex legal environment of P2P trading.
🌱 Sustainability: Managing an energy community and upgrading devices required deeper technical expertise.
Our Partnerships team validated the business proposition with stakeholders in the energy industry.
Focus Areas:
🚀 Mass onboarding.
📊 Results-driven operations.
3.2 Business Goals & User Needs
📈 Business Goals:
Increase user adoption by growing the number of active communities with connected energy devices.
Launch a marketplace enabling seamless P2P energy trading within and across local communities.
👤 Our Users:
1. Beginners (households, farmers, small business owners):
Easily set up their home in a local energy community.
Trade energy with neighbors with minimal friction.
Understand personal energy consumption and savings.
Sample Persona:
Willi, homeowner, 45+. Always looking for ways to improve their community, Willi finds it hard to access open knowledge. They engage with other communities and sustainable homeowners at events and forums to exchange ideas.
2. Advanced Users (researchers, energy entrepreneurs, hardware providers):
Create or expand energy communities by connecting to others.
Use simulation tools to model trading scenarios or justify investments.
Analyze detailed energy flows to inform strategic decisions or upgrades.
Key Objectives and KPIs
🎯 Objectives:
Deliver a simple onboarding experience for beginners while supporting advanced use cases through layered interactions.
Provide real-time visibility and interaction with live energy data.
Launch a feature-complete MVP within a 3-month pilot window to demonstrate traction to partners.
📊 KPIs:
Number of active communities created within 3 months.
% of users completing the onboarding flow (target: 70%+).
Number of P2P energy trades initiated in the first 8 weeks.
Time spent in simulation mode (an indicator of advanced user engagement).
User Feedback Score (CSAT) during the pilot phase.
Research & Insights
From Understanding to Actionable Design
To transform d3a.io from a functional prototype into a scalable, mass-adoption-ready product, we needed to identify both its potential and its friction points.
🔍 Research Methods:
1:1 user interviews with early adopters.
Observations during live demos to identify usability blockers.
Cross-functional workshops to synthesize findings and align on direction.
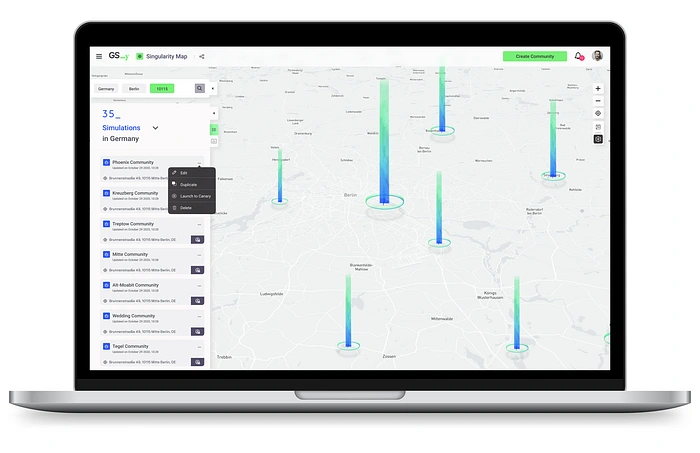
💡 Key Moment: In an August 2020 workshop, a participant compared building an energy community to “placing a house in The Sims.” This metaphor was a breakthrough, inspiring a visual, map-based experience with a clear sense of growth and connection.
We studied the Google Maps UI to adopt familiar interaction patterns, making it easy to “place” and connect homes.
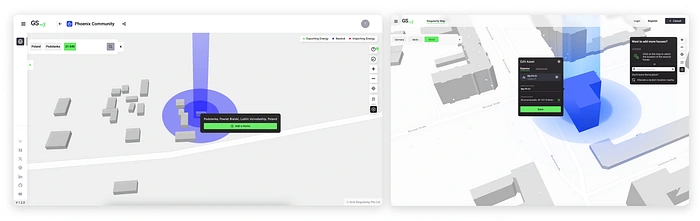
4.2 Turning Insights into Design Decisions
Insight 1: Users struggled to understand how to create and expand communities.
→ Decision: Introduced a drag-and-drop, map-based interface to make community building tangible and intuitive.
Insight 2: Advanced users wanted granular control over simulations.
→ Decision: Designed layered interfaces — simple defaults for beginners, with expandable panels and detailed data layers for experts.
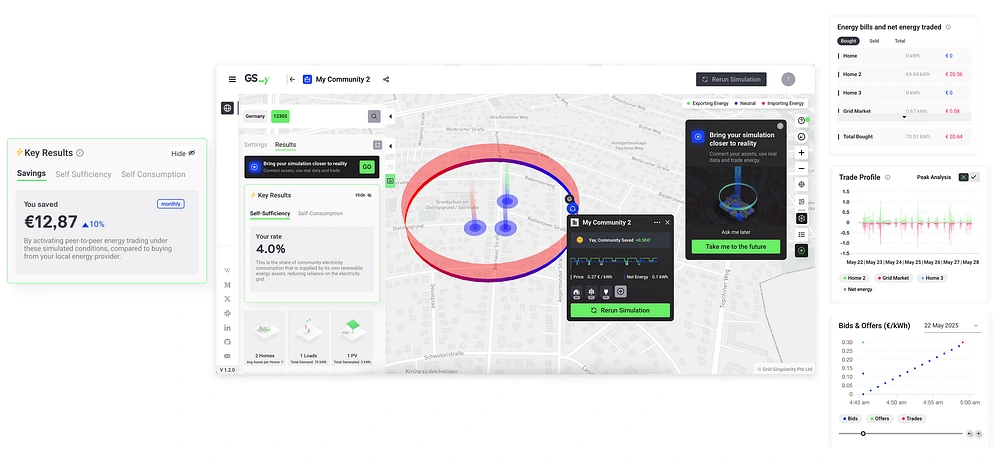
Insight 3: Users lacked clarity on energy flows and savings.
→ Decision: Integrated real-time feedback, intuitive graphs, and simplified language to show impact and optimize usage.
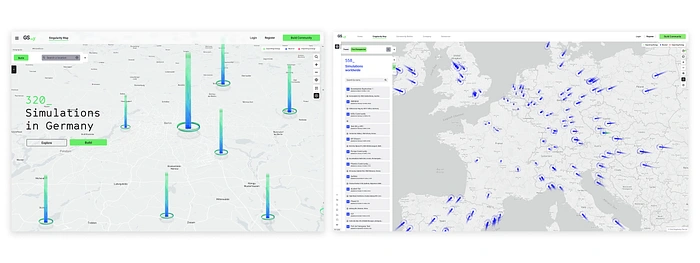
5. Design Decisions
We developed the Singularity Map as the central interface:
Map Layer: Shows connected homes, devices, and energy flows in real time.
Community Builder: Drag-and-drop creation of new communities and devices.
Simulation Mode: Test trading scenarios without affecting live systems.
Analytics Panel: Advanced data visualizations for experienced users.
Onboarding Flow:
A progressive onboarding process ensured that first-time users could create their first community within minutes, with contextual tips to guide the experience.
6. Usability Testing & Iterations
We ran three rounds of usability testing with a mix of beginners and advanced users:
Wireframe Testing: Verified navigation flow and task clarity.
2. Interactive Prototype: Tested drag-and-drop interactions and map zoom functions.
3. Beta Testing: Monitored live performance and community creation rates.
Key Findings & Changes:
Simplified onboarding copy after beginners skipped key steps.
Increased map contrast for better visibility of connections.
Added “quick add” device shortcuts for power users.
7. Constraints & Trade-offs
⛔ Constraints:
Legacy backend architecture limited the speed of real-time updates.
Blockchain transaction confirmation times introduced unavoidable delays.
Regulatory limitations prevented full launch in certain markets during the pilot.
⚖️ Trade-offs:
Prioritized onboarding simplicity over full customization in the MVP.
Deferred advanced analytics until after initial adoption goals were met.
8. Final Outcome & Impact
Measurable Impact:
🔥 Heatmaps + usability testing informed continuous design iterations
📉 Drop in support requests → More users navigated independently
🤝 Weekly Design + Biz Dev syncs turned feedback into improvements
📍 Medellín Pilot → Real-World Outcome
🏘️ 13 households / 60+ users
90% onboarding success
Solar payback shortened: 10 → 9 years
💡Up to 7% energy bill savings
🌐 Canary Network activated → pilot became a model for scaling

Thanks for reading!
Like this project
Posted Dec 30, 2025
Revamped a groundbreaking P2P energy trading tool for Grid Singularity, making it more user-friendly and accessible than ever before!
Likes
0
Views
0
Timeline
Jul 1, 2020 - Jul 1, 2022
Clients
Grid Singularity