Advanced Data Analytics & Interactive Sales Dashboards
Geta Viasu-Räisänen
Project Scope: Transforming Raw Sales Data into Actionable Insights
Building a Smart, Multi-Layered Klipfolio Dashboard to Track Sales Opportunities by Week, Month, and Quarter
In this advanced data visualization project, I helped a U.S.-based B2B supplier in the HVAC industry turn fragmented sales opportunity data into a dynamic business intelligence asset. My role was to design and build a custom Klipfolio dashboard that would deliver real-time insights into the movement, performance, and value of open, won, and lost deals — from company-wide patterns to individual sales rep metrics.
The source data was unstructured and not ready for visualization. Through data modeling, KPI engineering, and advanced date-based filtering, I developed an intuitive analytics tool that adapts to user-defined date ranges and granularity (weekly, monthly, or quarterly). The final product reveals win/loss rates, revenue trends, sales velocity, and rep-level performance — all in one smart, highly interactive dashboard. This has become one of the most insightful tools in the company’s sales analytics stack.
🎯Context & Objectives
This was one of the most ambitious dashboards I built for this client — and one of the most rewarding. They had plenty of opportunity data, but it was unstructured, inconsistent, and difficult to work with. Reporting was manual and fragmented, and there was no easy way to track sales performance or trends over time.
They needed a dynamic, interactive dashboard that could answer key business questions, such as:
Are we on track to hit our sales targets?
Which sales reps are closing deals fastest — and where are we losing momentum?
What’s our average sales cycle, and how is it changing over time?
How many open opportunities do we have right now — and what are they worth?
The goal: transform a raw CRM data source into a comprehensive sales performance dashboard that provides both executive-level clarity and rep-level insights.
I designed this tool to give decision-makers the ability to scan, explore, and act — without digging through spreadsheets or patching together reports.
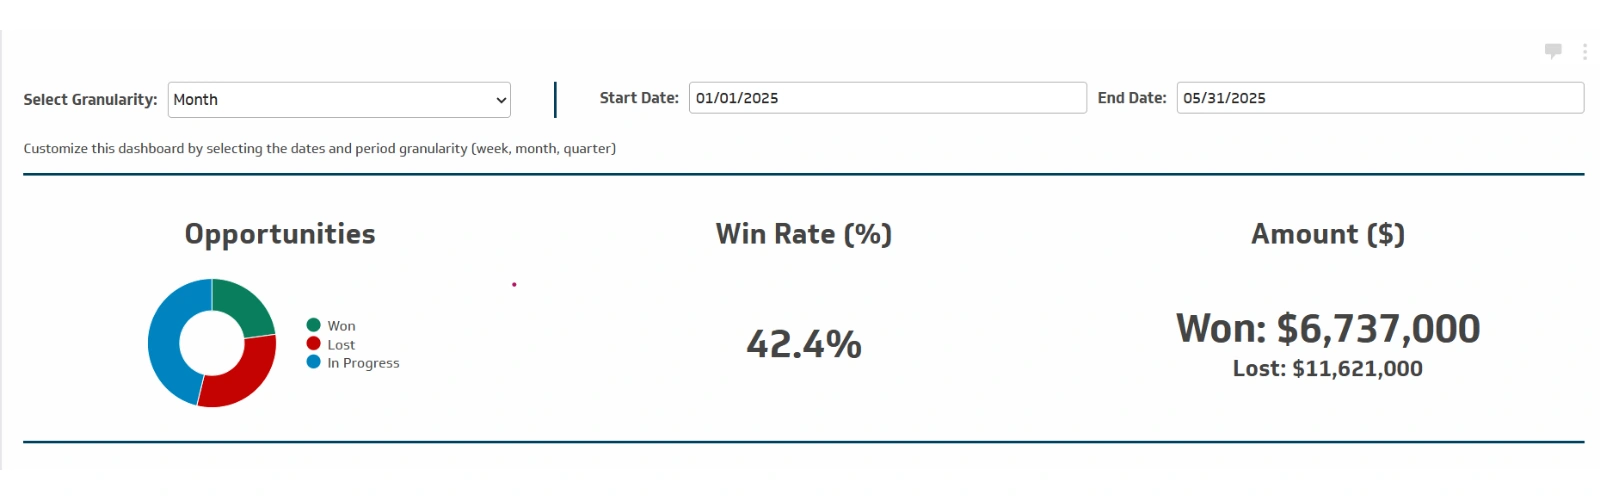
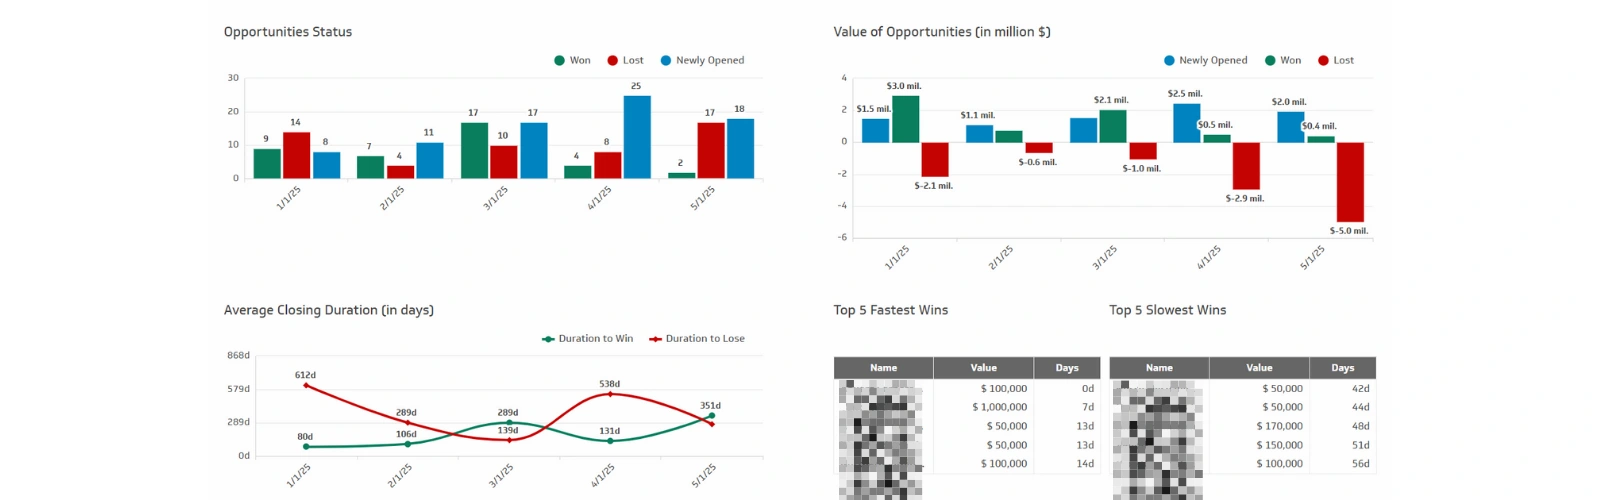
General Overview: Clarity at a glance - real-time win/loss breakdown
💪 Challenges & Solutions
Challenge: Overcoming Data Complexity to Unlock Actionable Insights
Solution: Creative data modeling and advanced calculations powering a powerful sales dashboard
This project came with significant data challenges that required creative problem-solving:
Raw, unclean data: The client’s original data source was neither cleaned nor aggregated. To build accurate time-based granularity (week, month, quarter), I created three separate modeled data tables, each aggregating values appropriately. This approach ensured consistent, reliable KPI calculations and dashboard behavior.
Complex date calculations: Calculating average days between dates presented difficulties due to inconsistent date formats. I developed formulas that handled these variations, delivering accurate metrics like average closing duration.
Dynamic sales rep counts: Because the number of sales reps fluctuates weekly and monthly, I engineered formulas to count unique reps per selected period. This was key for metrics like average open opportunities per rep.
Open opportunities segmentation: Determining which opportunities were “already open” at the start of a period versus “newly opened” inside the period demanded intricate formula logic and careful testing.
These solutions required formulas spanning many rows and layers of complexity. When initial attempts using single formulas proved unreliable, I pivoted to building dedicated modeled tables to maintain accuracy and dashboard performance.
The client was thrilled when I revealed insights they hadn’t realized were possible from their existing data — confirming the value of careful data modeling and tailored dashboard design.
🌟 Impact
This project was a powerful reminder of how much untapped potential often lies hidden in existing data. The biggest challenge was navigating complex, unclean data sources and crafting robust models to extract meaningful, reliable KPIs at multiple granularities.
The dashboard earned high praise from my client, who described the work as “excellent” and expressed surprise at the depth of KPIs extracted from a data source they had been using for years without fully realizing its potential.
While specific measurable results are still unfolding, this project has clearly demonstrated the true value of expert data analysis and visualization. By transforming raw, underutilized data into actionable insights, the dashboard has empowered the client with new perspectives on their sales pipeline and opportunity management.
This success reinforced the client’s confidence in the power of data-driven decision-making, solidifying my role as a trusted partner for future analytics projects.
Like this project
Posted Jun 18, 2025
I transformed complex, unclean data into an insightful, dynamic Klipfolio dashboard, enabling my client to track opportunities and unlock hidden potential.
Likes
0
Views
8
Timeline
Jun 5, 2025 - Jun 11, 2025