Executive KPI & Investigation Analytics Dashboard

Fixel Smith

Executive KPI & Investigation Analytics Dashboard
The challenge
Operational and investigation data was spread across multiple reporting views, making it difficult for leaders to see performance, workload, risk, and collection trends in one place.
The solution
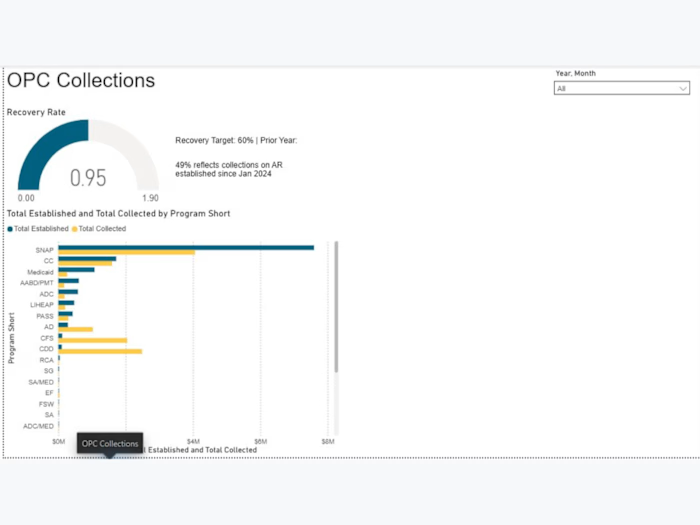
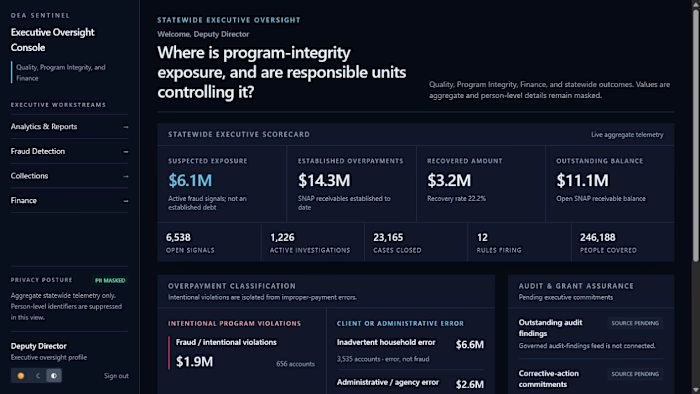
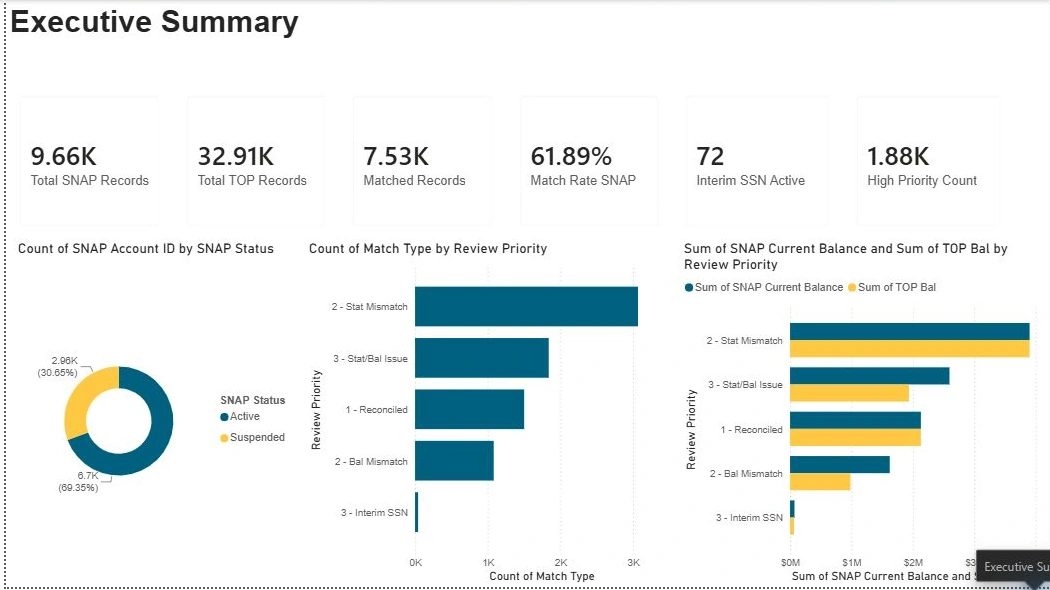
I designed a Power BI reporting experience that turns complex records into clear executive and operational views. The dashboard structure combines headline KPIs, trend analysis, filters, investigation metrics, and collections performance so users can move from an overview to the details that require attention.
My contribution
• Defined decision-focused KPIs and reporting hierarchy
• Structured and cleaned multi-source data for analysis
• Built dashboard layouts for executive and operational audiences
• Created interactive filtering and drill-down paths
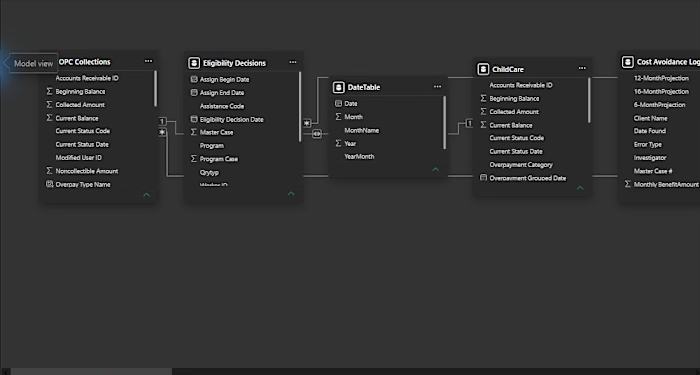
• Designed a semantic model that supports consistent measures
• Simplified dense reporting into an intuitive visual workflow
Result
A reusable analytics framework that helps decision-makers identify exceptions, compare performance, prioritize work, and communicate results more clearly.
All screenshots use sanitized or fictitious portfolio data. No confidential client or government information is displayed.
Like this project
Posted Jul 19, 2026
Designed an executive Power BI analytics system that unifies KPIs, investigation trends, workload, risk, and collections performance into clear decisions.