Airline Passenger & Revenue Analysis
Saurabh K. Negi
This project involved cleaning, organizing, and analyzing airline passenger and revenue data to identify trends and provide actionable insights. Key deliverables included:
Data Cleaning: Removed duplicates, handled missing values, and standardized formats for accurate analysis.
Data Analysis: Used Microsoft Excel to create pivot tables, charts, and summary reports for passenger trends and revenue patterns.
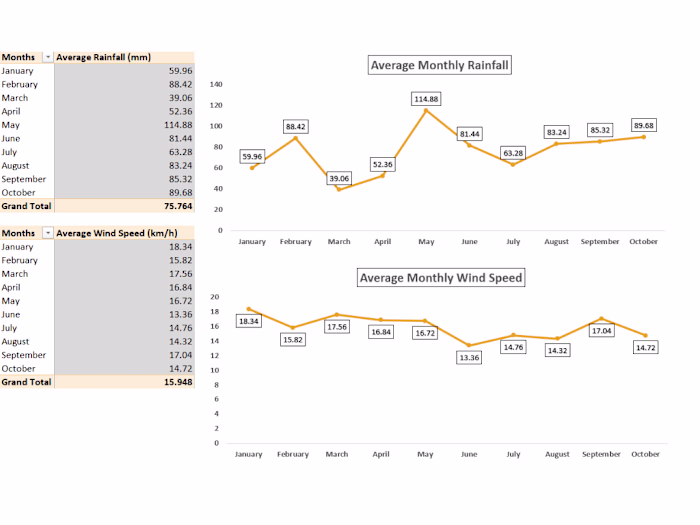
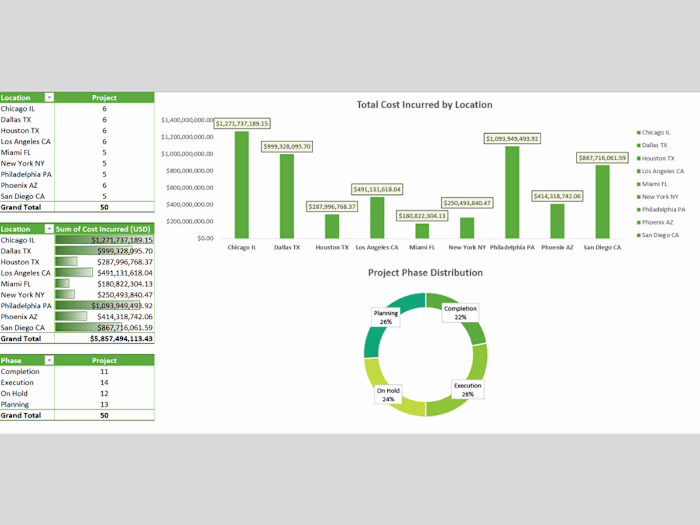
Visualization: Developed clear and informative graphs to highlight key performance metrics like load factors, revenue per available seat mile (RASM), and seasonal demand fluctuations.
Insights: Delivered insights to optimize ticket pricing, enhance seat allocation strategies, and improve revenue management.
Tools Used:
Microsoft Excel (Pivot Tables, Charts, Formulas)
Google Sheets
Data Cleaning Tools
Outcome:
Provided actionable insights that improved data-driven decision-making processes for airline revenue optimization.
Key Skills Applied:
Data Cleaning & Formatting
Trend Analysis
Revenue Optimization Metrics
Advanced Excel Functions
Like this project
Posted Jan 16, 2025
Analyzed airline passenger and revenue data using Excel, created pivot tables/charts, cleaned data, and provided insights for revenue optimization.